 Xiaojun Song
 Samad Rahimnejad2,3†
 Wenhao Zhou
 Kangle Lu
- 1Laboratory for Animal Nutrition and Immune Molecular Biology, College of Life Sciences, Qingdao Agricultural University, Qingdao, China
- 2Laboratory of Aquatic Animal Nutrition and Physiology, Fisheries College, Jimei University, Xiamen, China
- 3South Bohemian Research Center of Aquaculture and Biodiversity of Hydrocenoses, Institute of Aquaculture and Protection of Waters, Faculty of Fisheries and Protection of Waters, University of South Bohemia in České Budějovice, České Budějovice, Czechia
PGC1α is a transcriptional coactivator that plays key roles in mitochondrial biogenesis, so exploring its molecular characterization contributes to the understanding of mitochondrial function in cultured fish. In the present study, a full-length cDNA coding PGC1α was cloned from the liver of blunt snout bream (Megalobrama amblycephala) which covered 3741 bp with an open reading frame of 2646 bp encoding 881 amino acids. Sequence alignment and phylogenetic analysis revealed high conservation with other fish species, as well as other higher vertebrates. Comparison of the derived amino acid sequences indicates that, as with other fish, there is a proline at position 176 (RIRP) compared to a Thr in the mammalian sequences (RIRT). To investigate PGC1α function, three in vitro tests were carried out using primary hepatocytes of blunt snout bream. The effect of AMPK activity on the expression of PGC1α was determined by the culture of the hepatocytes with an activator (Metformin) or inhibitor (Compound C) of AMPK. Neither AMPK activation nor inhibition altered PGC1α expression. Knockdown of PGC1α expression in hepatocytes using small interfering RNA (si-RNA) was used to determine the role of PGC1α in mitochondrial biogenesis. No significant differences in the expression of NRF1 and TFAM, and mtDNA copy number were found between control and si-RNA groups. Also, hepatocytes were cultured with oleic acid, and the findings showed the significant reduction of mtDNA copy number in oleic acid group compared to control. Moreover, oleic acid down-regulated the expression of NRF1 and TFAM genes, while PGC1α expression remained unchanged. Our findings support the proposal that PGC1α may not play a role in mitochondrial biogenesis in blunt snout bream hepatocytes.
Introduction
The peroxisome proliferator-activated receptor-gamma coactivator 1 (PGC1) family members are transcriptional coactivators that play key roles in the transcriptional control of mitochondrial biogenesis and respiratory function (Scarpulla, 2011). PGC1α was the first characterized PGC1 family member being identified as a stimulator of thermogenin expression in brown adipose tissue of mice (Puigserver et al., 1998). The other family members including PGC1β and PGC1-related coactivator (PRC) were subsequently discovered through database searches for PGC1α homologs. These three PGC1 proteins share some features but they also have distinct functions. PGC1α and PGC1β share several activation roles within the cell including developmental differentiation in mitochondrial biogenesis and adaptation to external stimuli such as nutrition and exercise (Goto et al., 2000; Mortensen et al., 2006; Uldry et al., 2006).
PGC1α has the capability to bind different factors in an independent manner, which enables it to act as a regulator for mitochondrial biogenesis in mammals and birds (Puigserver and Spiegelman, 2003; Handschin and Spiegelman, 2006; Vercauteren et al., 2008). Although the role of PGC1α in mitochondrial biogenesis of mammals and birds has been well established, it still remains to be elucidated in fish (Bremer et al., 2016). In mammalian cells, the primary upstream kinase of PGC1α is AMP-activated protein kinase (AMPK), which has also been identified as a regulator of mitochondrial biogenesis. Further, activated PGC1α in mammals often stimulates the transcription of numerous genes associated with mitochondrial biogenesis such as nuclear respiratory factor 1 (NRF1) and mitochondrial transcription factor A (TFAM). The AMPK-PGC1α-NRF1 pathway is well established in mammalian models, but this axis remains unclear in fish. Interestingly, the findings of a recent study indicated that the AMPK-PGC1α-NRF1 may be disrupted in fish (Bremer et al., 2016). This may indicate that different species probably adopt distinct solutions for controlling mitochondrial biogenesis. From an evolutionary point of view, duplication events and mutations often induce divergence/diversity in function of genes between fish and mammals (Sémon and Wolfe, 2007).
In cultured fish, intake of excessive fat often impairs mitochondrial biogenesis and causes dysfunction of lipid metabolism (Lu et al., 2013a,b). Blunt snout bream (Megalobrama amblycephala) is an herbivorous freshwater fish native to China. It has been a favorable fish for aquaculture in China because of its fast growth, tender flesh, and high disease resistance. However, incidence of mitochondrial dysfunction has been a common phenomenon in its farming in captivity which is associated with oxidative stress and apoptosis (Lu et al., 2014). The objectives of this research were to (1) achieve the molecular characterization of PGC1α, (2) elucidate AMPK-PGC1α-NRF1 axis in mitochondrial biogenesis, and (3) explore the role of PGC1α in controlling mitochondria content.
Materials and Methods
Experimental Fish and Sample Collection
All the fish were treated in accordance with the principles of the Basel Declaration and Recommendations of Animal Research Institute Committee guidelines, Jimei University, China. Blunt snout bream juveniles were obtained from a private hatchery (Guangzhou, China), transported to the Fisheries laboratory of Jimei University, and cultured in a recirculating aquaculture system under the following conditions: water temperature, 25–27°C; DO, 5.0–6.0 mg l−1; pH 7.2–7.6. Fish were fed a commercial diet (31% protein, 7% lipid) (ALPHA feed Co. Ltd., China) for 1 week to acclimate them to the experimental conditions. At the end of the acclimation period, fish were used for gene cloning and hepatocyte culture studies. Prior to sampling, fish (weight: 20 ± 1 g) were starved for 24 h and then euthanized with 100 mg l−1 of MS-222 (tricaine methanesulfonate; Sigma, United States). Tissue samples including heart, liver, white muscle, red muscle, gills, and adipose tissue were immediately collected, flash frozen in liquid nitrogen and then stored at −80°C.
PGC1α cDNA Cloning
Total RNA was extracted from liver using RNAiso Plus (Takara Co. Ltd., Japan). RNA samples were treated by RQ1 RNase-Free DNase prior to RT-PCR (Takara Co. Ltd., Japan) to avoid genomic DNA amplification. Quantity and purity of isolated RNA were subsequently determined by absorbance measures at 260 and 280 nm, and its integrity was tested by electrophoresis in 1.0% formaldehyde denaturing agarose gels. The partial fragment of PGC1α was obtained by high throughput sequencing as described earlier (Zhang et al., 2015), and added to the National Institutes of Health’s Short Read Archive database (accession no. SRX679226). According to the sequence information of this fragment, gene-specific primers were designed for RACE (Supplementary Table S1). Rapid amplification of the 5′ end was performed using the 5′ RACE System of Invitrogen. Briefly, 2 μg sample RNA was used with PGC1α5-R to obtain the first strand cDNA. After RNase treatment, an Oligo (dC) at the 5′ end was added using terminal deoxynucleotidyl transferase. The resulting product was used as a template for the first PCR amplification at 94°C for 2 min and 30 cycles of amplification at 94°C for 30 s, 55°C for 30 s, 72°C for 60 s, and 72°C for 7 min. Then, the first PCR product was used as a template for the nested PCR. The nested PCR product was eluted from 1% agarose gel and delivered to Shanghai Sangon Biotech Service Co. Ltd. (Shanghai, China) for sequencing. Rapid amplification of the 3′ end was performed using the 3′-full RACE Core Set (TaKaRa, Dalian, China) following the manufacturer’s instructions. After the first and nested PCRs (consisted of 25 cycles of 30 s at 94°C, 30 s at 65°C and 1 min at 68°C), the PCR product was eluted from 1.0% agarose gel using a PCR purification kit (QIAGEN, United States) and sequenced.
Alignment, Phylogenetic and Codon-Based Sequence Analysis
A multiple sequence alignment was performed for homology sequences of PGC1 family members using MUSCLE with default parameters, which were manually curated if necessary. Gene structure and position of motifs were checked by hand using data from Entrez genes, and domain conservation was predicted by SMART software1. Phylogenetic analyses were conducted using MrBayes 3.2 for a Bayesian analysis employing a mixed amino acid substitution model. The CODEML program in the PAML4.4 software package was used to analyze changes in selective pressure which allow for variable selection patterns among amino acid sites, M0, M1a (nearly neutral), M2a (positive selection), M7 (beta), M8 (beta and ω), to test for the presence of sites under positive selection. The presence of codons evolving under positive selection was further tested by contrasting the M1a and M2a models, and the M7 and M8 models by likelihood ratio tests (LRTs). To explore the divergence of different branches of PGC1 family genes in the evolutionary history, a branch model of the CODEML software was used to compute the non-synonymous/synonymous substitution rate ratio of different branches. Finally, positive selection sites in fish PGC1α sequences were detected by applying a branch-site model and statistical analysis by Bayes empirical Bayes (BEB) methods.
Hepatocytes Culture, Treatment and siRNA Transfection
Isolation of Hepatocytes
Prior to isolation of hepatocytes, fish were anesthetized with 100 mg l−1 of MS-222 and bled by cutting the gill arches. Then, liver was rapidly isolated and washed several times in ice-cold phosphate buffered saline (PBS) containing antibiotic (100 IU ml−1 penicillin G sodium and 100 IU ml−1 streptomycin). After removal of PBS using sterile pipette, the samples were cut into small pieces (about 1 mm3) and digested with pancreatin at 28°C for 30 min. Thereafter cell suspension was centrifuged at 500 g for 10 min and washed twice. The harvested cell pellets were re-suspended in Leibovitz’s L-15 medium (L15 medium) (HyCloneTM, United States) with 15% fetal bovine serum (Biological Industries, United States) at a density of 1 × 10⁶ ml−1. For each test three different fish were used and each time the livers were pooled to make a single sample. The viability of hepatocytes was assayed before the beginning of each trial using a Cell Counting Kit-8 (CCK-8, Dojindo Laboratories, Kumamoto, Japan).
Culturing Hepatocytes With AMPK Activator/Inhibitor
Cells attached and cultured in 2 ml of the following media: control medium (L15), AMPK activated metformin (L15+ 200 μM metformin) and AMPK inhibited Compound C (L15+ 100 μM Compound C). After culturing for 48 h, cells were harvested by trypsinization (0.25% trypsin–EDTA) at 25°C in 5 min for analyzing the expression of PGC1α. All the tests were performed in three replicates.
Western blots were used to measure the level of phospho-AMPKα. Briefly, cell pellets (about 108 cells) were lysed in ice-cold lysis buffer (Cell Signaling, Danvers, MA, United States) and centrifuged at 12000 g for 5 min, and then the resulting supernatants were stored at −80°C. Total protein was determined according to the methods outlined by Bradford (1976). Aliquots of each sample were added to an equal volume of SDS sample buffer (Laemmli, 1970), boiled for 5 min, and 20 μg of total protein was loaded into each well, separated by SDS-PAGE for 1–2 h at 100 V using a Mini-Protean system (Bio-Rad, Spain) and transferred to a polyvinylidene fluoride (PVDF) membrane (Millipore, Burlington, MA, United States). Subsequently, the membrane was blocked with blocking buffer (20 mM Tris-HCl, 150 mM NaCl, 0.05% Tween-20, pH 7.6) containing 5% (w/v) non-fat dry milk for 1 h. The membrane was then incubated with rabbit polyclonal antibodies against GAPDH blots (Cell Signaling Technology, United States) and antiphospho-AMPKα (#2535, Cell Signaling Technology, United States) at 4°C overnight. After washing, membranes were incubated with anti-rabbit secondary antibody. Bands were visualized by an electro-chemiluminescence (ECL) system (GE Healthcare, Buckinghamshire, United Kingdom) and quantified by the densitometry band analysis tool in ImageJ.
Transfection
Hepatocytes were transfected with small interfering RNA (siRNA) duplexes (5′-Chol, 2′-Ome) for PGC1α (si-PGC1α) or negative control (GenePharma), which were named siRNA-PGC1α group and siRNA-NC group, respectively. The sequences of si-PGC1α duplexes were as follows: sense sequence, 5′-GGAUGUCAGUGACCUCGAUTT-3′; anti-sense sequence, 5′-AUCGAGGUCACUGACAUCCTT-3′. The sequences of NC siRNA duplexes were as follows: sense sequence, 5′-UUCUCCGAACGUGUCACGUTT-3′; anti-sense sequence, 5′-ACGUGACACGUUCGGAGAATT-3′. The delivery of siRNA duplexes was carried out using Lipofectamine® RNAiMAX Transfection Reagent (Invitrogen) according to the manufacturer’s instructions. Cells were incubated with siRNA-lipid complex for 48 h, and then harvested to measure the expression of PGC1α, NRF1, and TFAM genes, and mitochondrial content. All the tests were performed in three replicates.
Culturing Hepatocytes With Oleic Acid
Two milliliters of isolated hepatocytes was seeded in each well of 6-well culture plates. After 24 h, all cells attached and cultured in 2 ml of the following media: control medium (L15) and oleic acid medium (L15+ 600 μM oleic acid). Oleic acid was purchased from Sigma Chemicals (O1250). After 72 h, the cells were collected for analysis. Then, cells were harvested by trypsinization (0.25% trypsin–EDTA) at 25°C in 5 min to measure the expression of PGC1α, NRF1 and TFAM genes, and mitochondrial content. All the tests were performed in three replicates.
Gene Expression
Quantitative real-time PCR (qPCR) method was used to determine the mRNA abundance as gene expression. Expression of PGC1α in six tissues including liver, white muscle, red muscle, heart, fat tissue, and gill was measured in vivo test. Expression of PGC1α, NRF1 and TFAM in cultured hepatocytes was also determined by qPCR.
Extraction of total RNA and first strand cDNA synthesis were performed as described above. Real-time PCR was employed to determine mRNA abundance based on the SYBR Green I fluorescence kit. Primer characteristics used for real-time PCR are listed in Supplementary Table S1, according to the MIQE Guidelines (Bustin et al., 2011). Real-time PCR was performed in a Mini Option real-time detector (Bio-Rad, United States). The fluorescent quantitative PCR reaction solution consisted of 12.5 μl SYBR® premix Ex TaqTM (2×), 0.5 μl PCR forward primer (10 μM), 0.5 μL PCR reverse primer (10 μM), 2.0 μL RT reaction (cDNA solution), and 9.5 μL ddH2O. The reaction conditions were as follows: 95°C for 3 min followed by 45 cycles consisting of 95°C for 10 s and 60°C for 20 s. The fluorescent flux was then recorded, and the reaction continued at 72°C for 3 min. The dissociation rate was measured between 65 and 90°C. Each increase of 0.2°C was maintained for 1 s, and the fluorescent flux was recorded. All amplicons were initially separated by agarose gel electrophoresis to ensure that they were of correct size. A dissociation curve was determined during the PCR program to make sure that specific products were obtained in each run. At the end of the reaction, the fluorescent data were converted into Ct values. Each expression level was normalized to ribosomal protein L13a (Rpl13a) using the 2−ΔΔCT method without correction for primer efficiency.
Mitochondrial Content Assay
Mitochondrial content is typically measured directly through qPCR quantitation of mitochondrial DNA (mtDNA) copies expressed relative to nDNA (Reverter et al., 2017). DNA was extracted using Qiagen DNeasy tissue ‘on column’ system as per manufacturer’s instructions. The mtDNA content was expressed relative to nDNA copy number (Reverter et al., 2017). Primers for mtDNA (ND1) were: forward primer 5′ TAGCCCCTGCCTGACCACT 3′, reverse primer 5′ CTGGGATGTGGTGAATGTGTGA 3′, and for nDNA (beta-globin): forward primer 5′ GAATGCTCATCGTCTACCCTCA 3′, reverse primer 5′ ATGGCTGTCATCACAGTTTTGC 3′. The mtDNA copy number was calculated using real time PCR method as described earlier (Sun et al., 2012).
Statistical Analysis
Data were analyzed by SPSS 16.0 for Windows software (SPSS, Chicago, IL, United States). One-way analysis of variance (ANOVA) with post hoc multiple comparison by Student–Newman–Keuls test was used to analyze differences of data from three groups. Student’s t-test was used to analyze differences of data from two groups. The level of significance was set at P < 0.05. All data were presented as means ± standard error of the mean (SEM).
Results
Characterization of PGC1α
The full-length PGC1α cDNA sequence was submitted to Genbank (accession number: MH791034). This full-length cDNA covered 2646 bp of open reading frame (ORF) encoding an 881 AA polypeptide, 138 bp of 5′-untranslated region (UTR) and 957 bp of 3′-UTR, and contained a canonical polyadenylation signal (AATAA) (Figure 1). Furthermore, analysis by SMART software showed that M. amblycephala PGC1α protein also contained an RRM domain in C-terminal (Figure 2A). Recent studies showed that PGC1 proteins could be phosphorylated though the conserved sequence (HNHRIRTNPAIVKTE) in N-terminal of human. The results of multiple alignment showed that there was a difference in the position of the Thr in the snout bream sequence (RIRPTP), as well as compared to the mammalian sequence (RIRTNP). Since the Thr is an important AMPK-phosphorylation site within the human sequence, this presence of the proline and the absence of the Thr in the other fish sequences may indicate a difference in the function of PGC1α between fish and humans (Figure 2B).
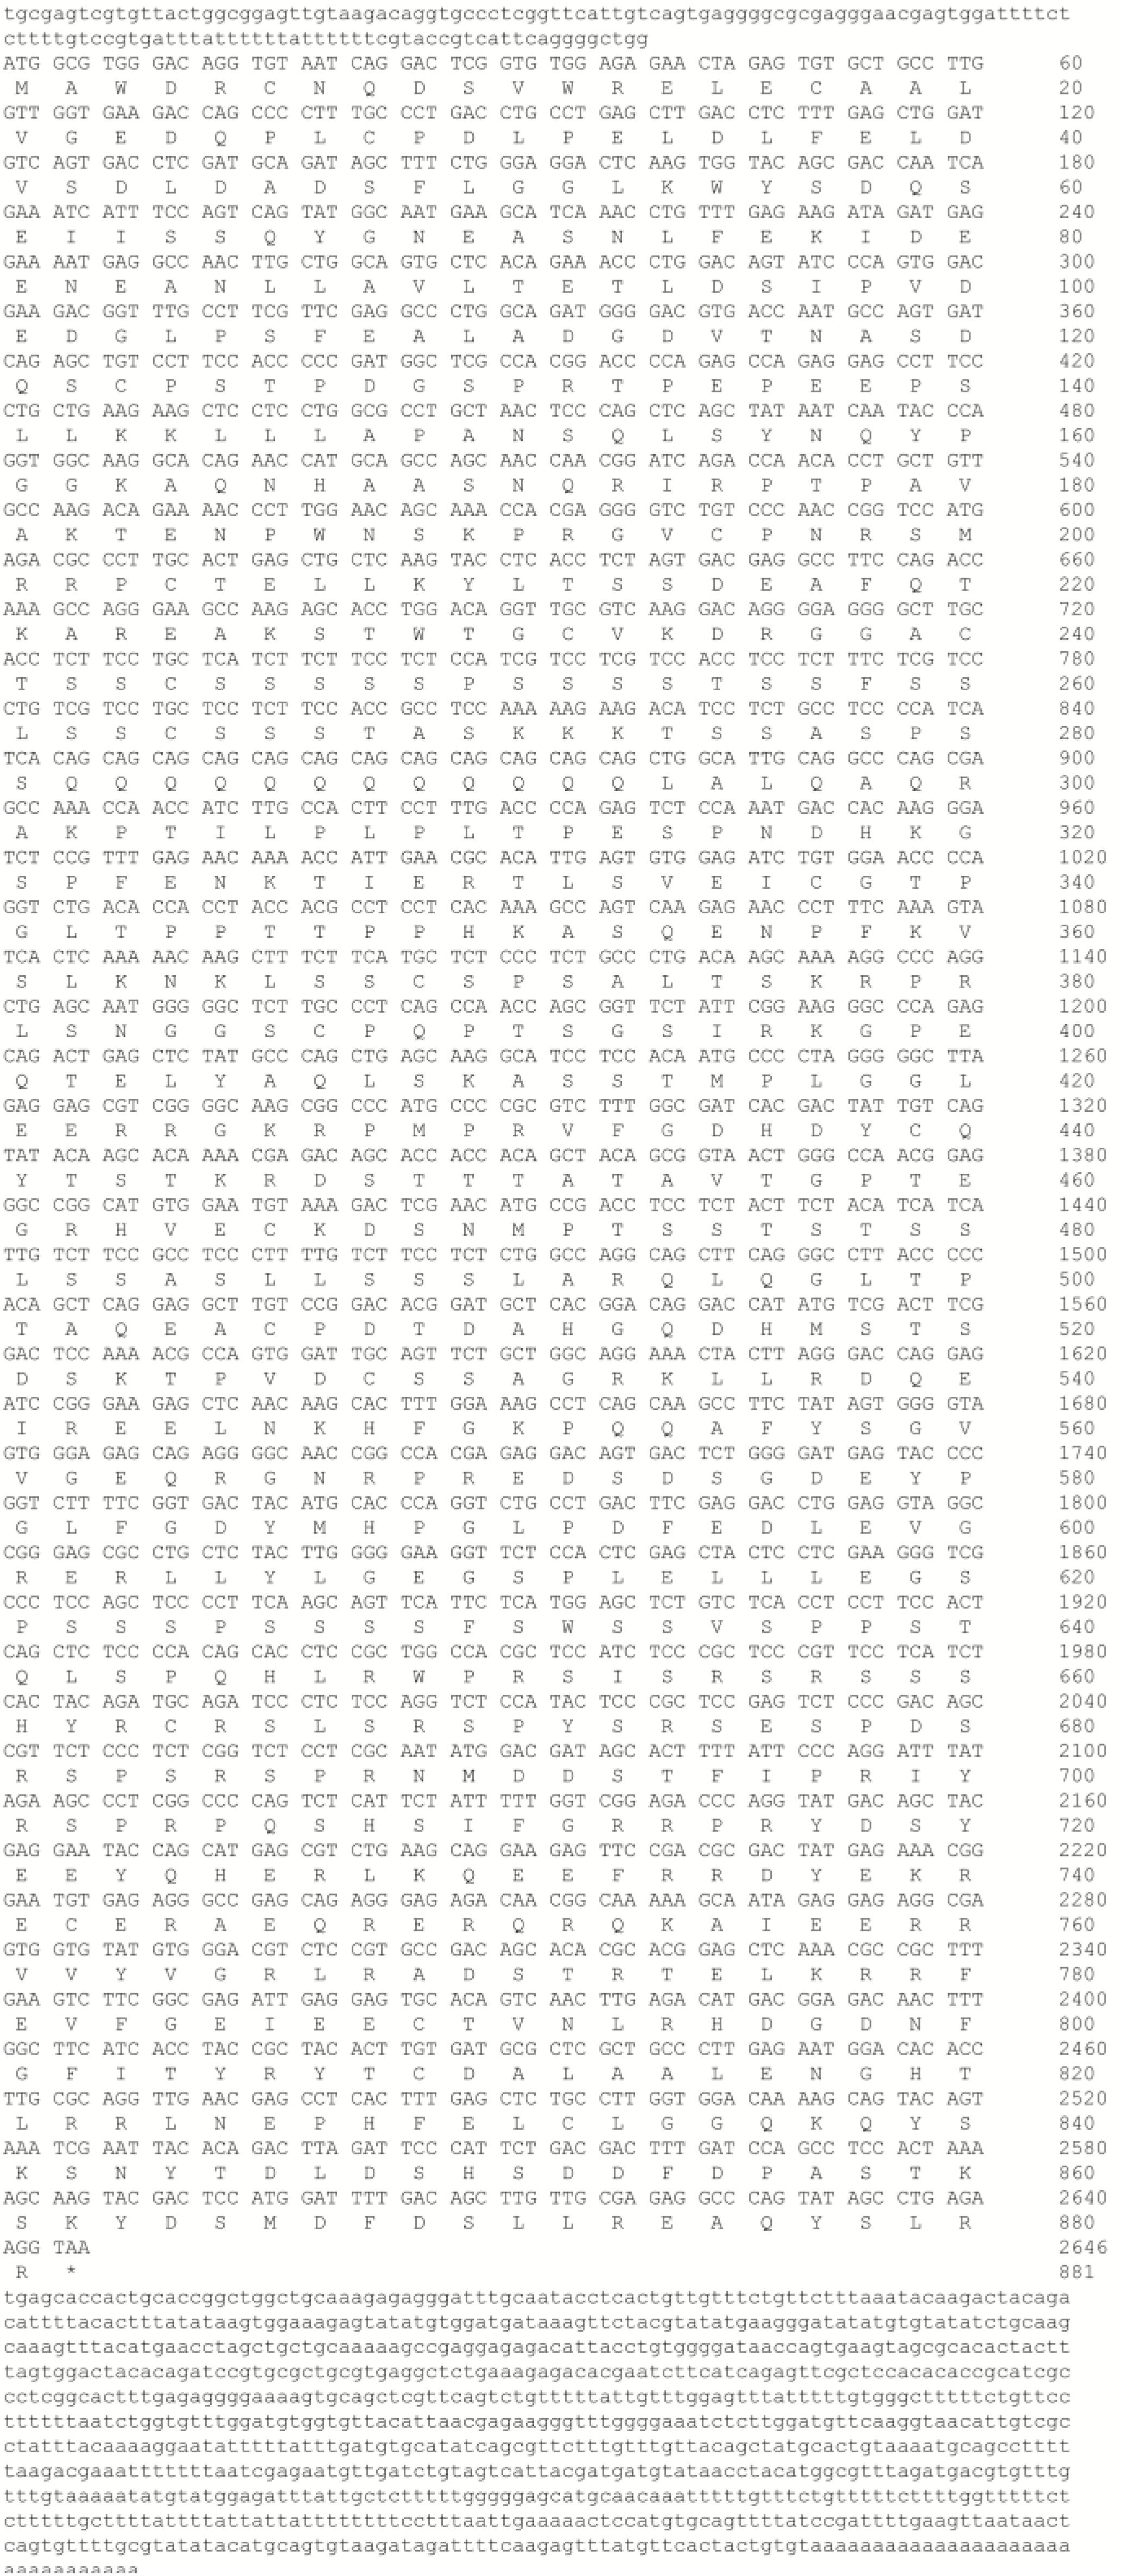
Figure 1. The nucleotide sequence of the PGC1α cDNA in M. amblycephala, and the deduced amino acid sequence. Uppercase letters indicate the translated region, whereas lowercase letters represent the un-translated region.
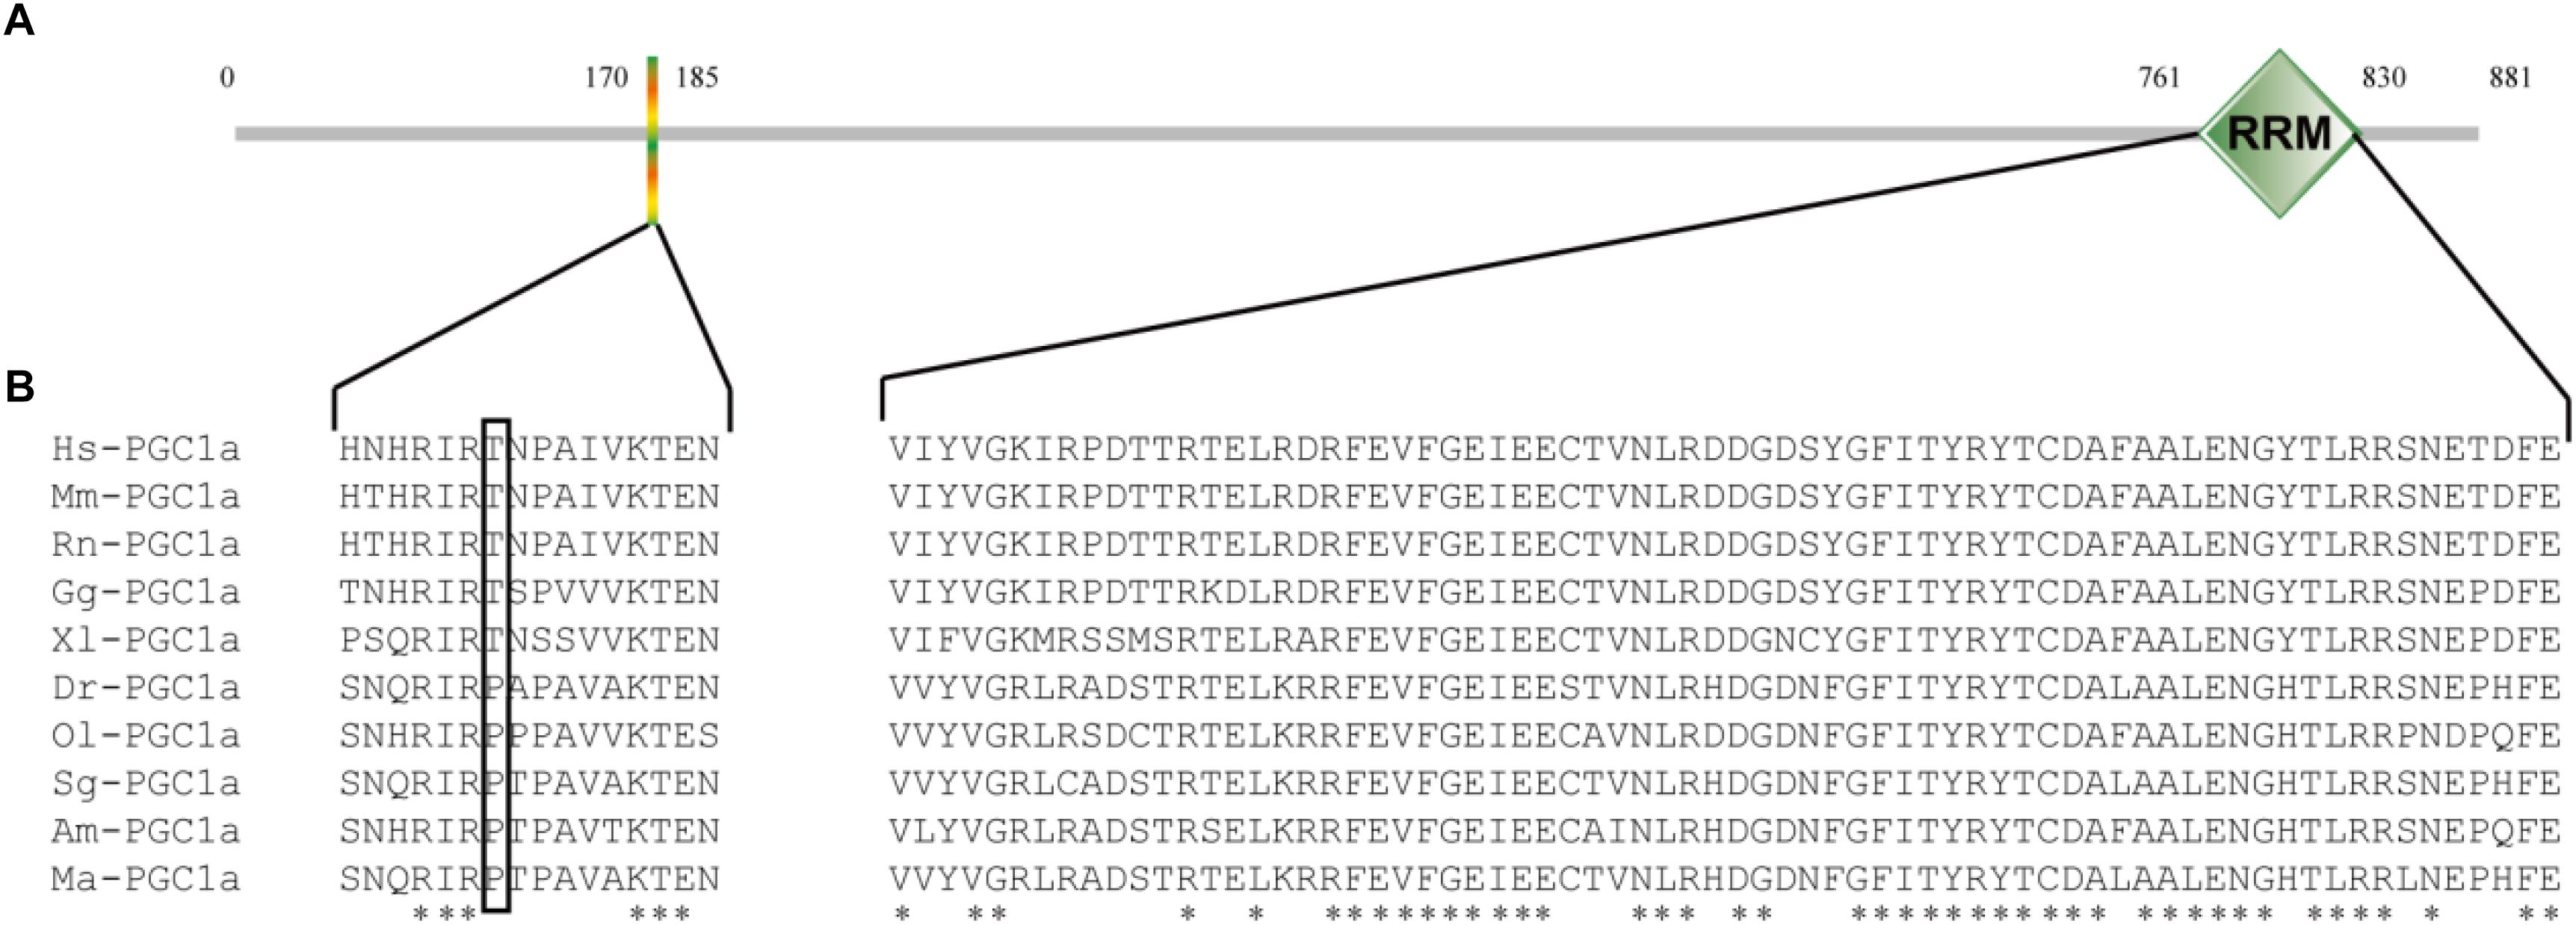
Figure 2. The sequence analysis of M. amblycephala PGC1α. (A) The domain structure of M. amblycephala PGC1α protein by SMART software, which contains a RRM domain only. (B) The multiple sequence alignment analysis of PGC1α proteins among M. amblycephala and other vertebrate animals. Hs, Homo sapiens; Mm, Mus musculus; Rn, Rattus norvegicus; Gg, Gallus gallus; Xl, Xenopus laevis; Dr, Danio rerio; Ol, Oryzias latipes; Sg, Sinocyclocheilus graham; Am, Astyanax mexicanus; Ma, M. amblycephala.
To explore the functional divergence of PGC1α between mammals and M. amblycephala, the CODEML program of PAML4.4 software package was used to analyze the changes in selective pressure of PGC1 family proteins in the evolutionary history. Although the PGC1 family members underwent very strong purifying selection (ω = 0.23) (Table 1), a branch underwent positive selection when the fish evolved to amphibians, birds and mammals (ω = 1.27) (Figure 3). Nine positive selection sites were detected by M7 vs. M8 model (Table 1). We used branch-site model to examine whether specific positive selection sites exist in fish, and the results showed that there are 43 positive selection sites.
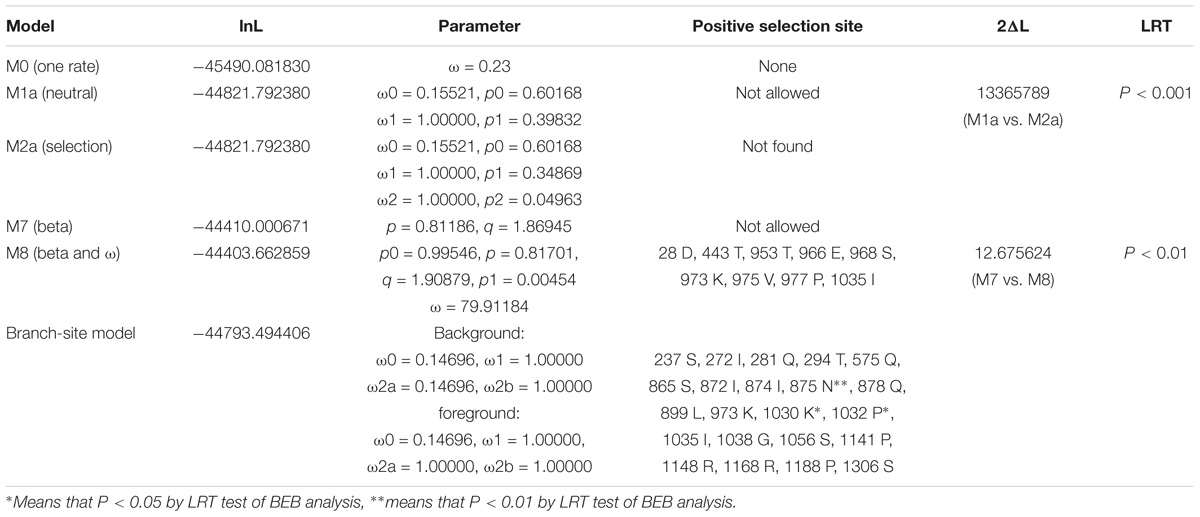
Table 1. Likelihood values and parameter estimates of computing position selection site by site-specific model and branch-site model for the PGC1 family members.
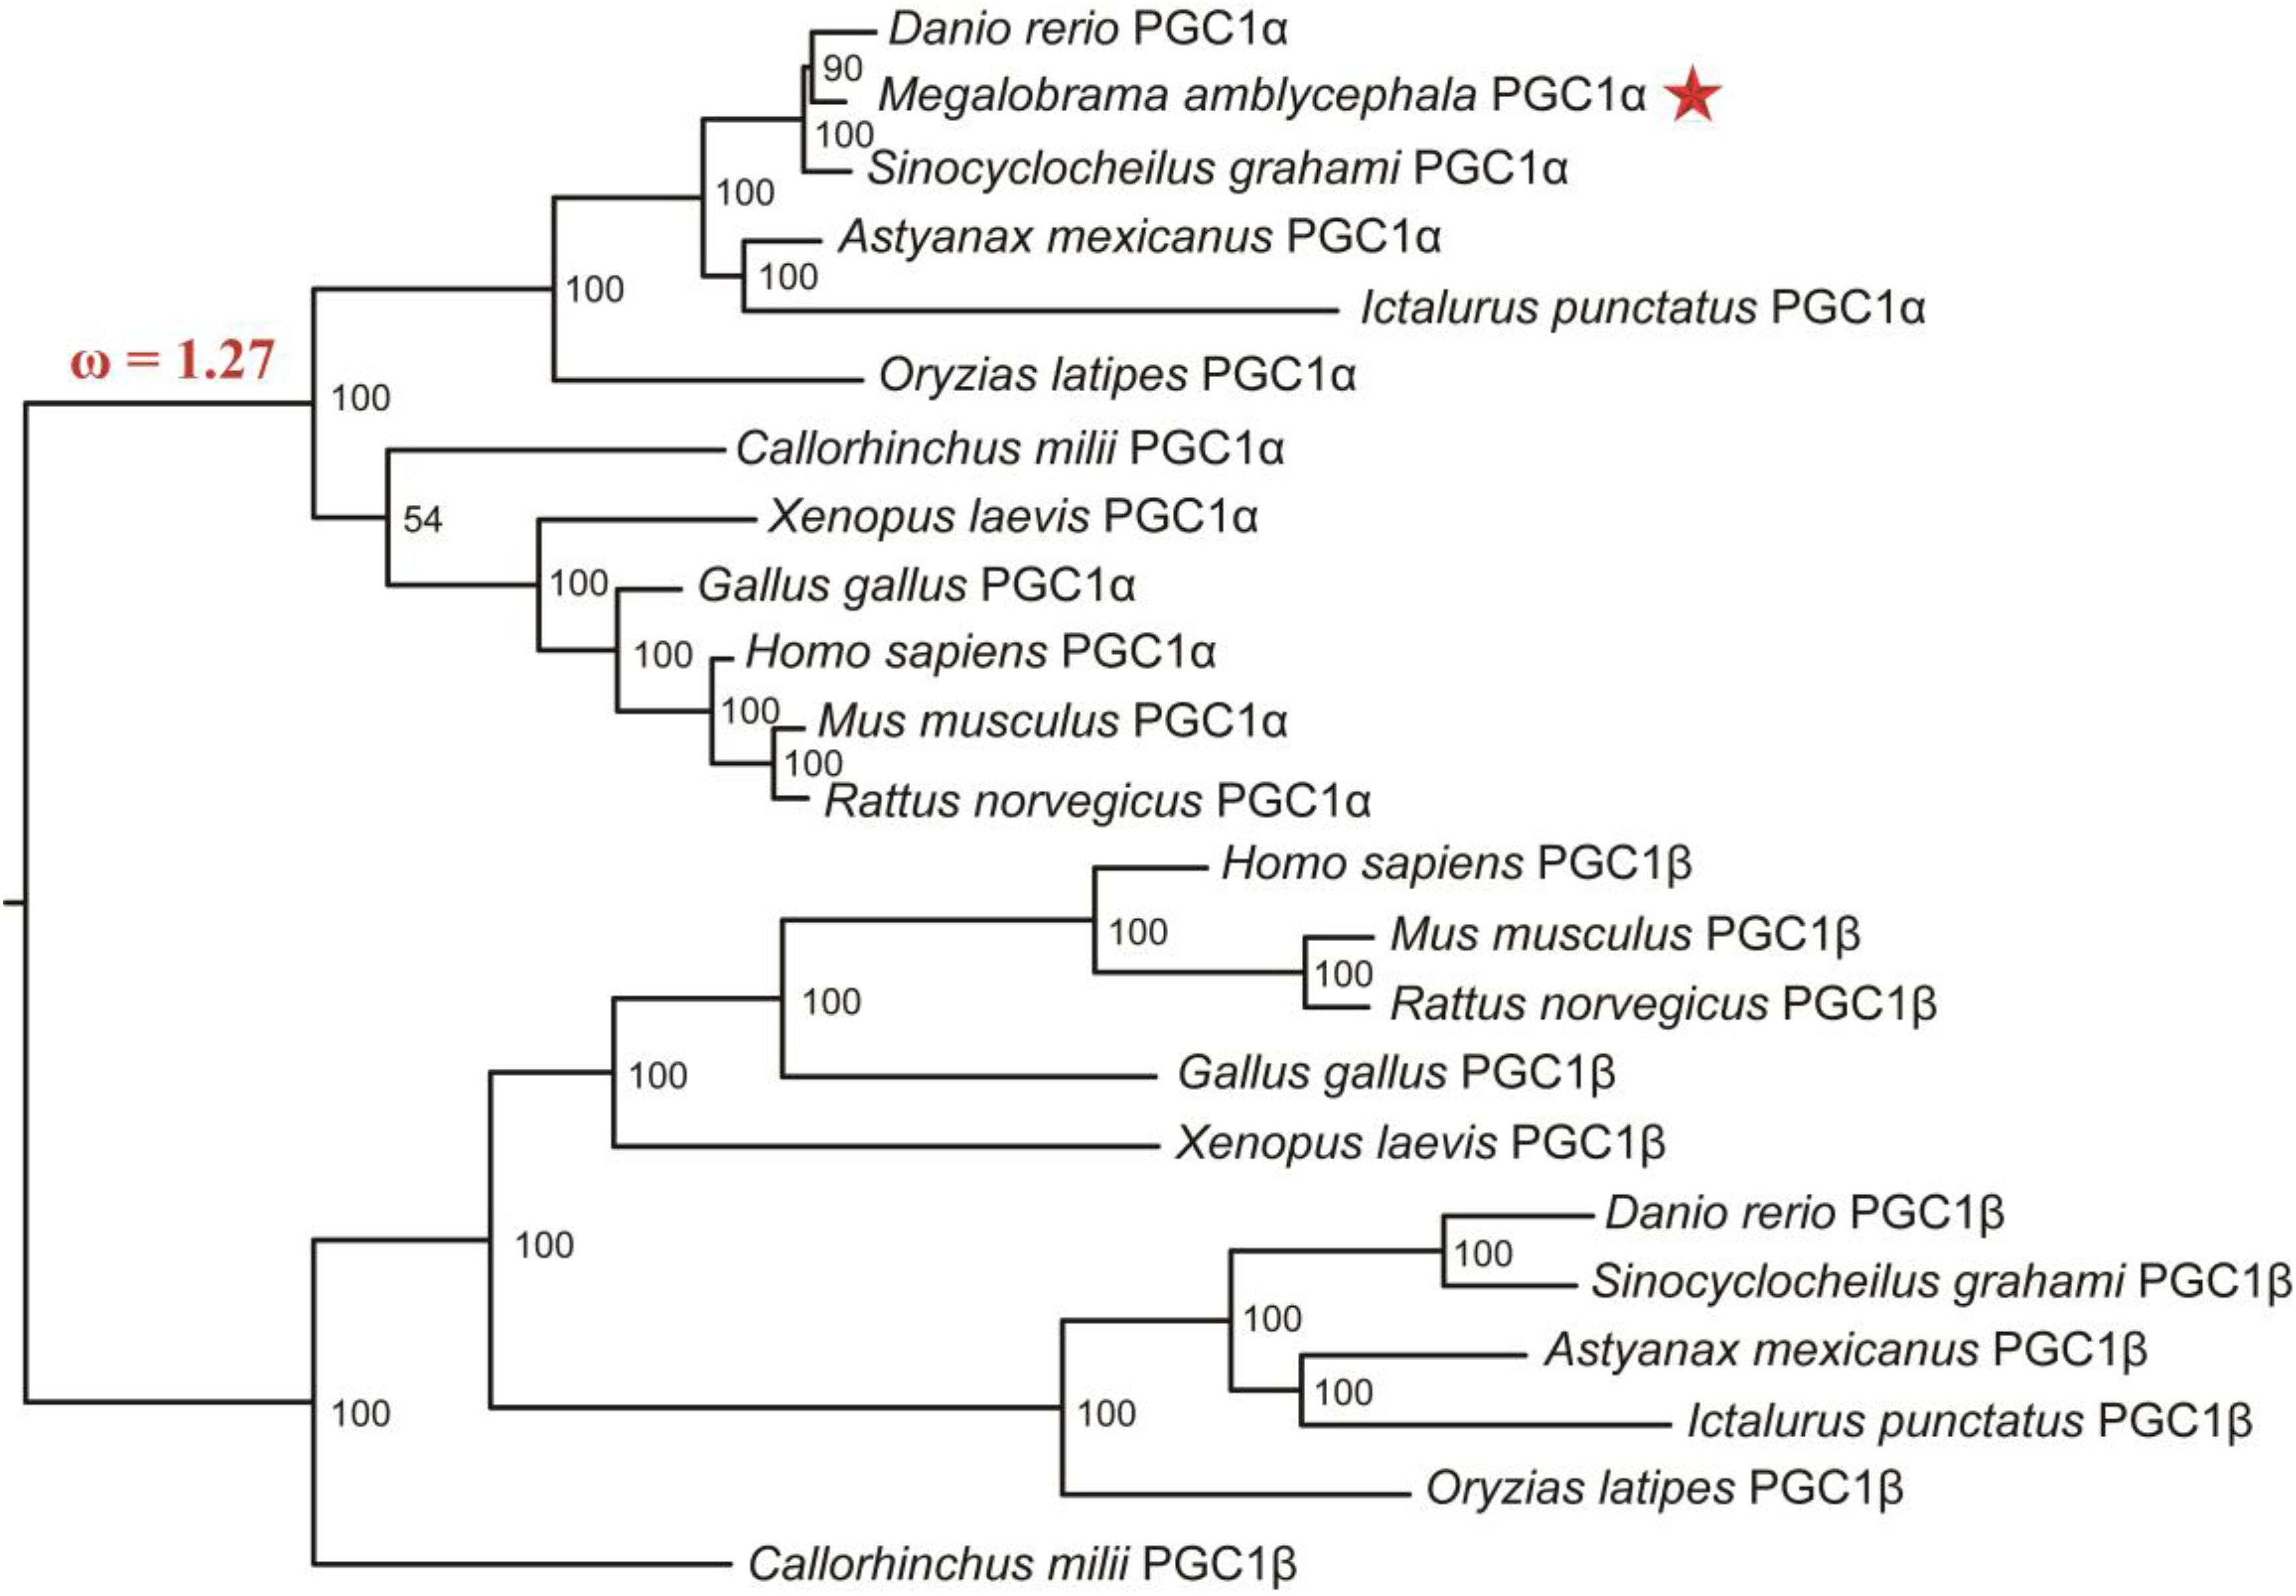
Figure 3. Phylogenetic tree of PGC1 family proteins including M. amblycephala PGC1α protein (marked by star on the right of the evolution tree). The Bayesian analysis results showed that the PGC1 family proteins were classified into two groups: PGC1α group and PGC1β group with high bootstrap values. The ω value on the branch of phylogenetic tree represents non-synonymous/synonymous substitution rate (ω = dn/ds), which provides a measurement for the change of selective pressure.
Phylogenetic Analyses
To explore the origin and evolutionary history of PGC1 family, Blastp or tBlastn were employed to retrieve the distribution of PGC1 family members in different animals. There is no homologous of PGC1 family in genomes of Cyclostomata, Urochordata, Cephalochordate and other invertebrate (data not shown), but more than two RRM domains present. This may indicate domain rearrangement in the evolutionary history of PGC1 family.
The evolutionary relationships of PGC1 family were revealed by the topology of a phylogenetic tree supported by high bootstrap values. As expected, the PGC1 family proteins were categorized into PGC1α and PGC1β groups. Conservation of PGC1α became evident from the high bootstrap values observed between M. amblycephala PGC1α and that of other fish species including Cypriniformes species: Danio rerio and Sinocyclocheilus graham; Siluriformes species: Ictalurus punctatus; and Beloniformes species: Oryzias latipes (Figure 3). The phylogenetic relationship based on the PGC1 family proteins was consistent with the traditional classification.
The Role of PGC1α in Controlling Mitochondria Content
PGC1α gene ubiquitously expressed with varying levels in all the tested tissues. As shown in Figure 4A, the highest expression of PGC1α was observed in red muscle followed by white muscle, heart, liver, fat tissue, and gill, respectively. The mtDNA copy number of M. amblycephala was the highest in heart, moderate in liver and red muscle and low in fat tissue and gill (Figure 4B). A correlation analysis was used to examine whether PGC1α regulates the mitochondrial content in M. amblycephala, and the results showed that PGC1α does not regulate the mtDNA copy number in M. amblycephala (Pearson’s correlation coefficient: r = 0.058, P = 0.914; Spearman correlation coefficient: ρ = 0.257, P = 0.623).
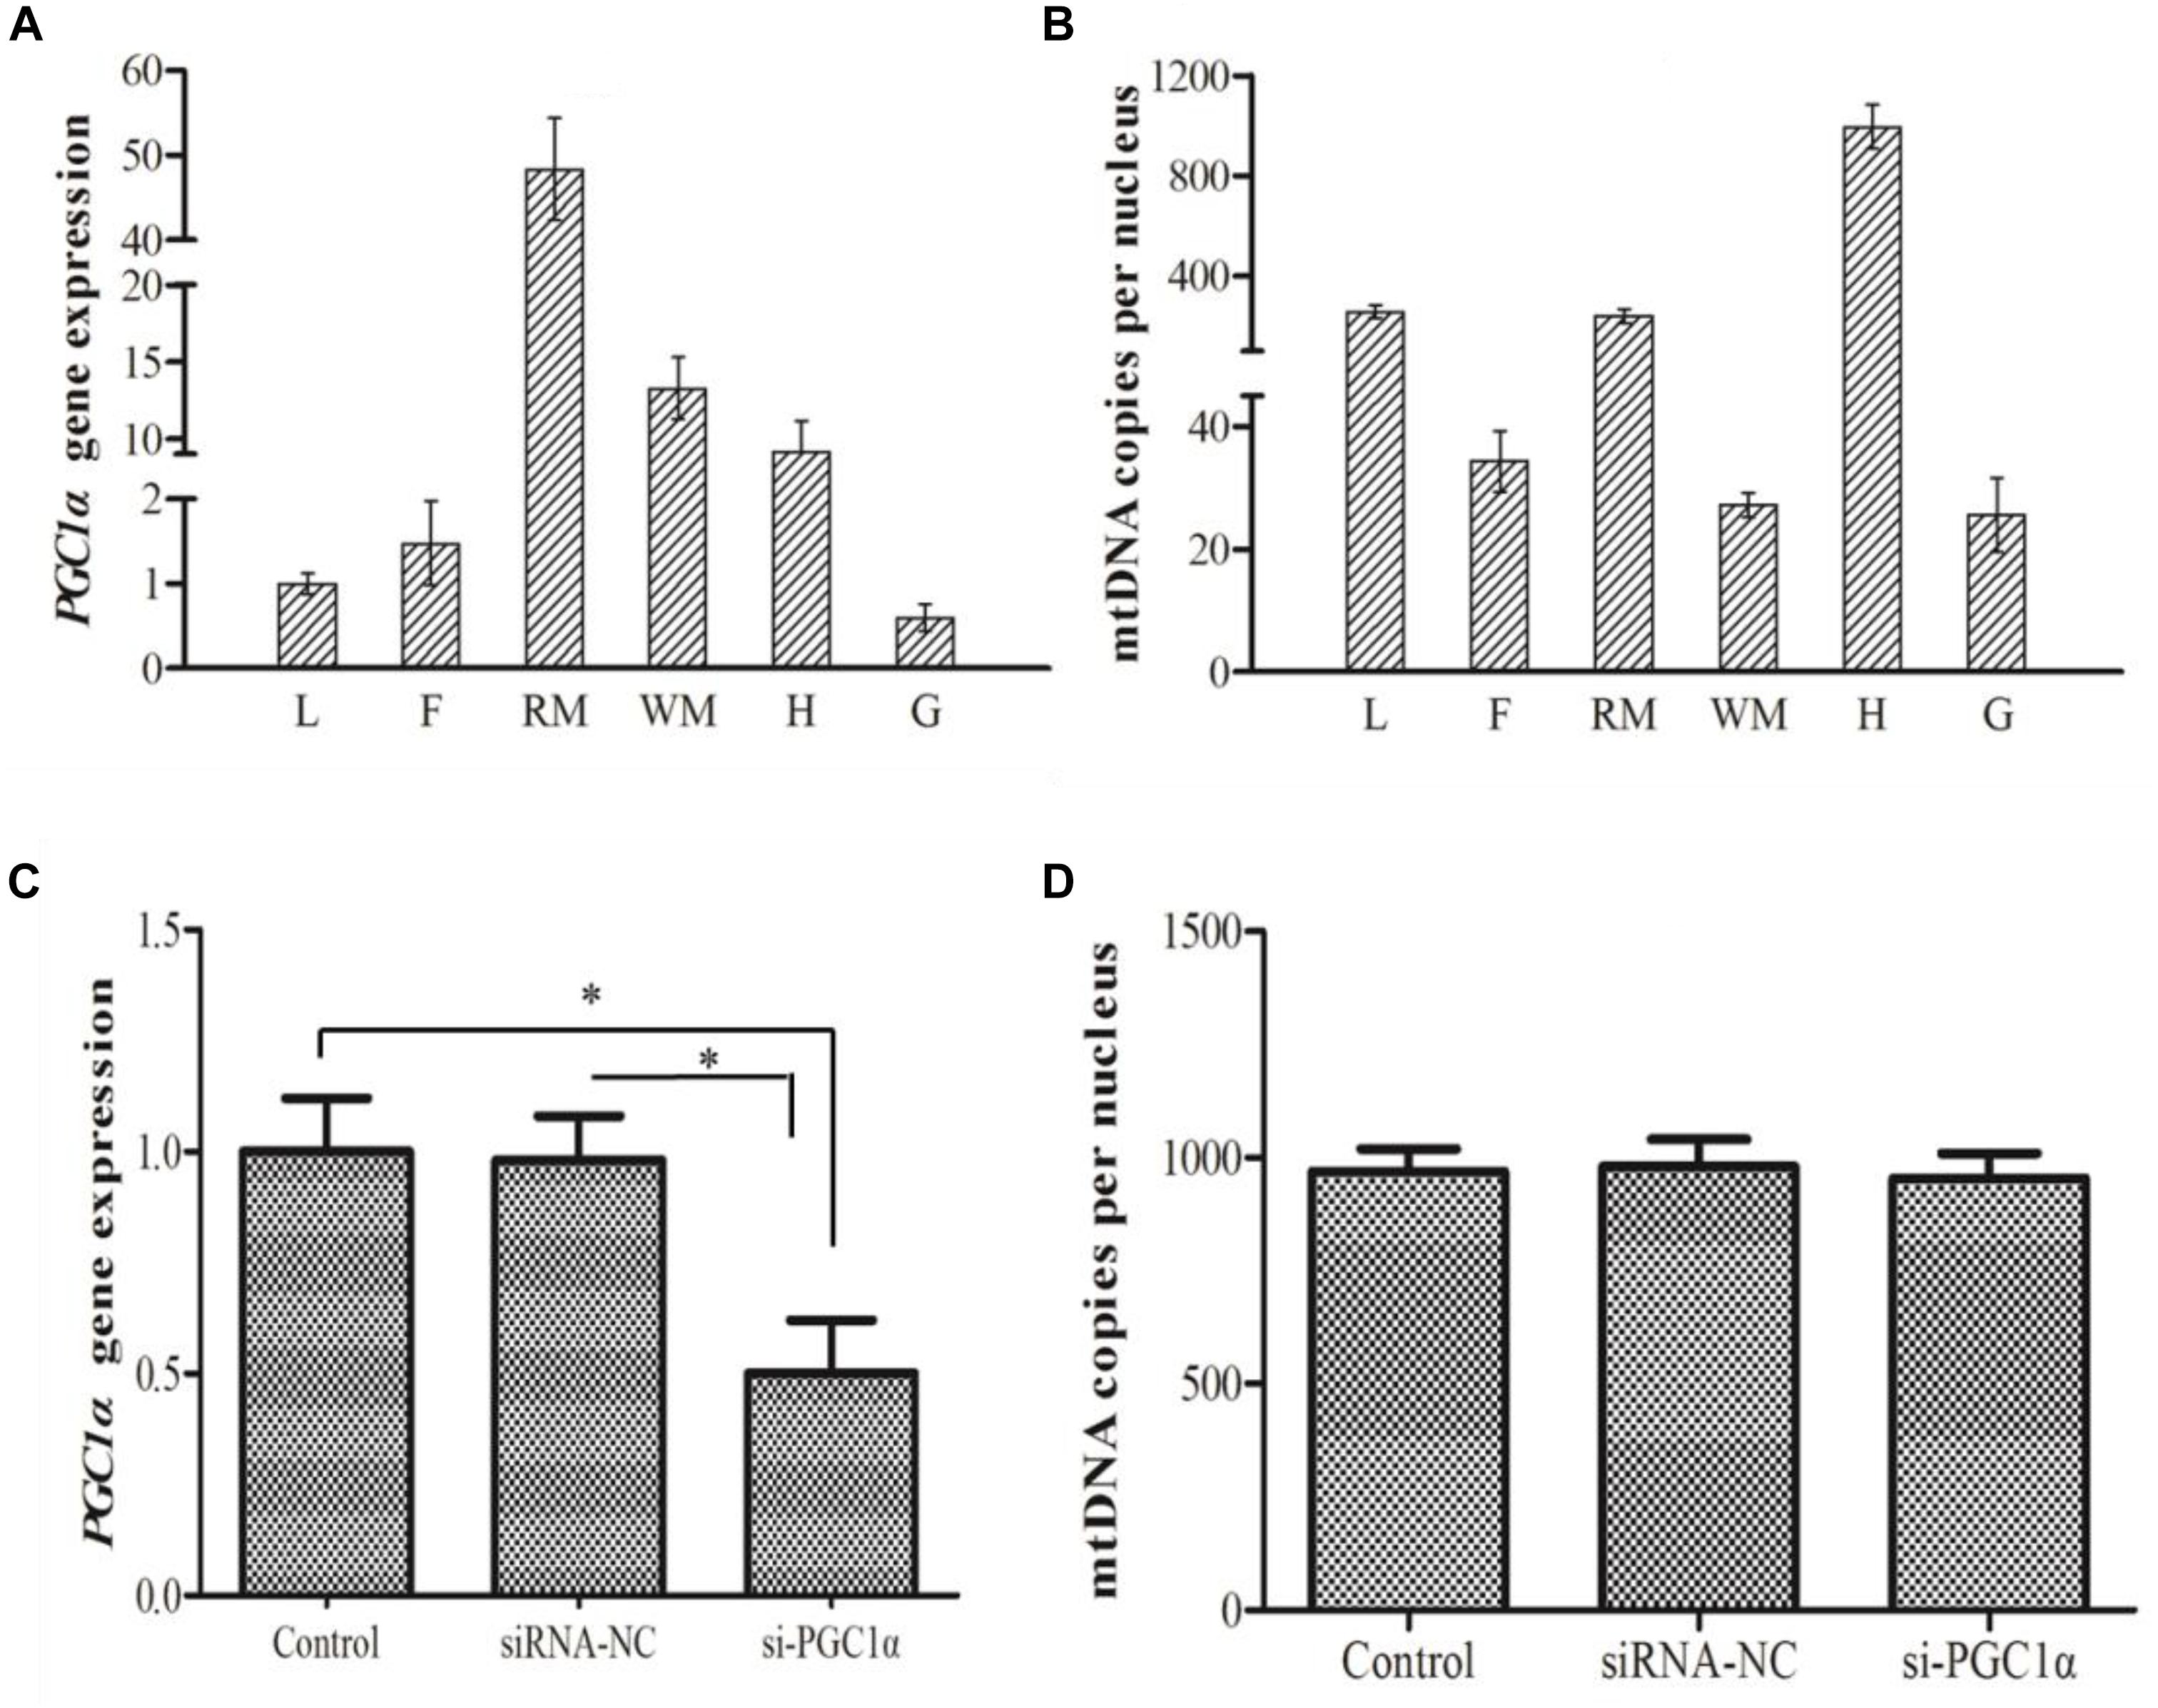
Figure 4. The gene expression of PGC1α (A) and mtDNA copy number (B) in different tissues of M. amblycephala (L, liver; F, fat tissue; RM, red muscle; WM, white muscle; H, heart; G, gill). The expression of PGC1α (C) and mtDNA copy number (D) in primary hepatocytes of M. amblycephala after the knockdown of PGC1α. One-way analysis of variance (ANOVA) with post hoc multiple comparison by Student–Newman–Keuls test was used to analyze differences. The asterisk indicate significant difference (P < 0.05).
In order to evaluate the correlation between PGC1α expression and mitochondrial content, siRNA technology was used to knockdown expression of PGC1α. The expression of PGC1α was significantly down-regulated (P = 0.001) in si-RNA group compared to control group (Figure 4C). However, there was no significant difference in mtDNA copy number between control and siRNA groups (Figure 4D).
PGC1α Response to AMPK Activation/Inhibition
In this study, metformin/Compound C was used as activator/inhibitor of the AMPK activity. The findings showed that there was no change in PGC1α expression following either activation or inhibition of AMPK (Figure 5).
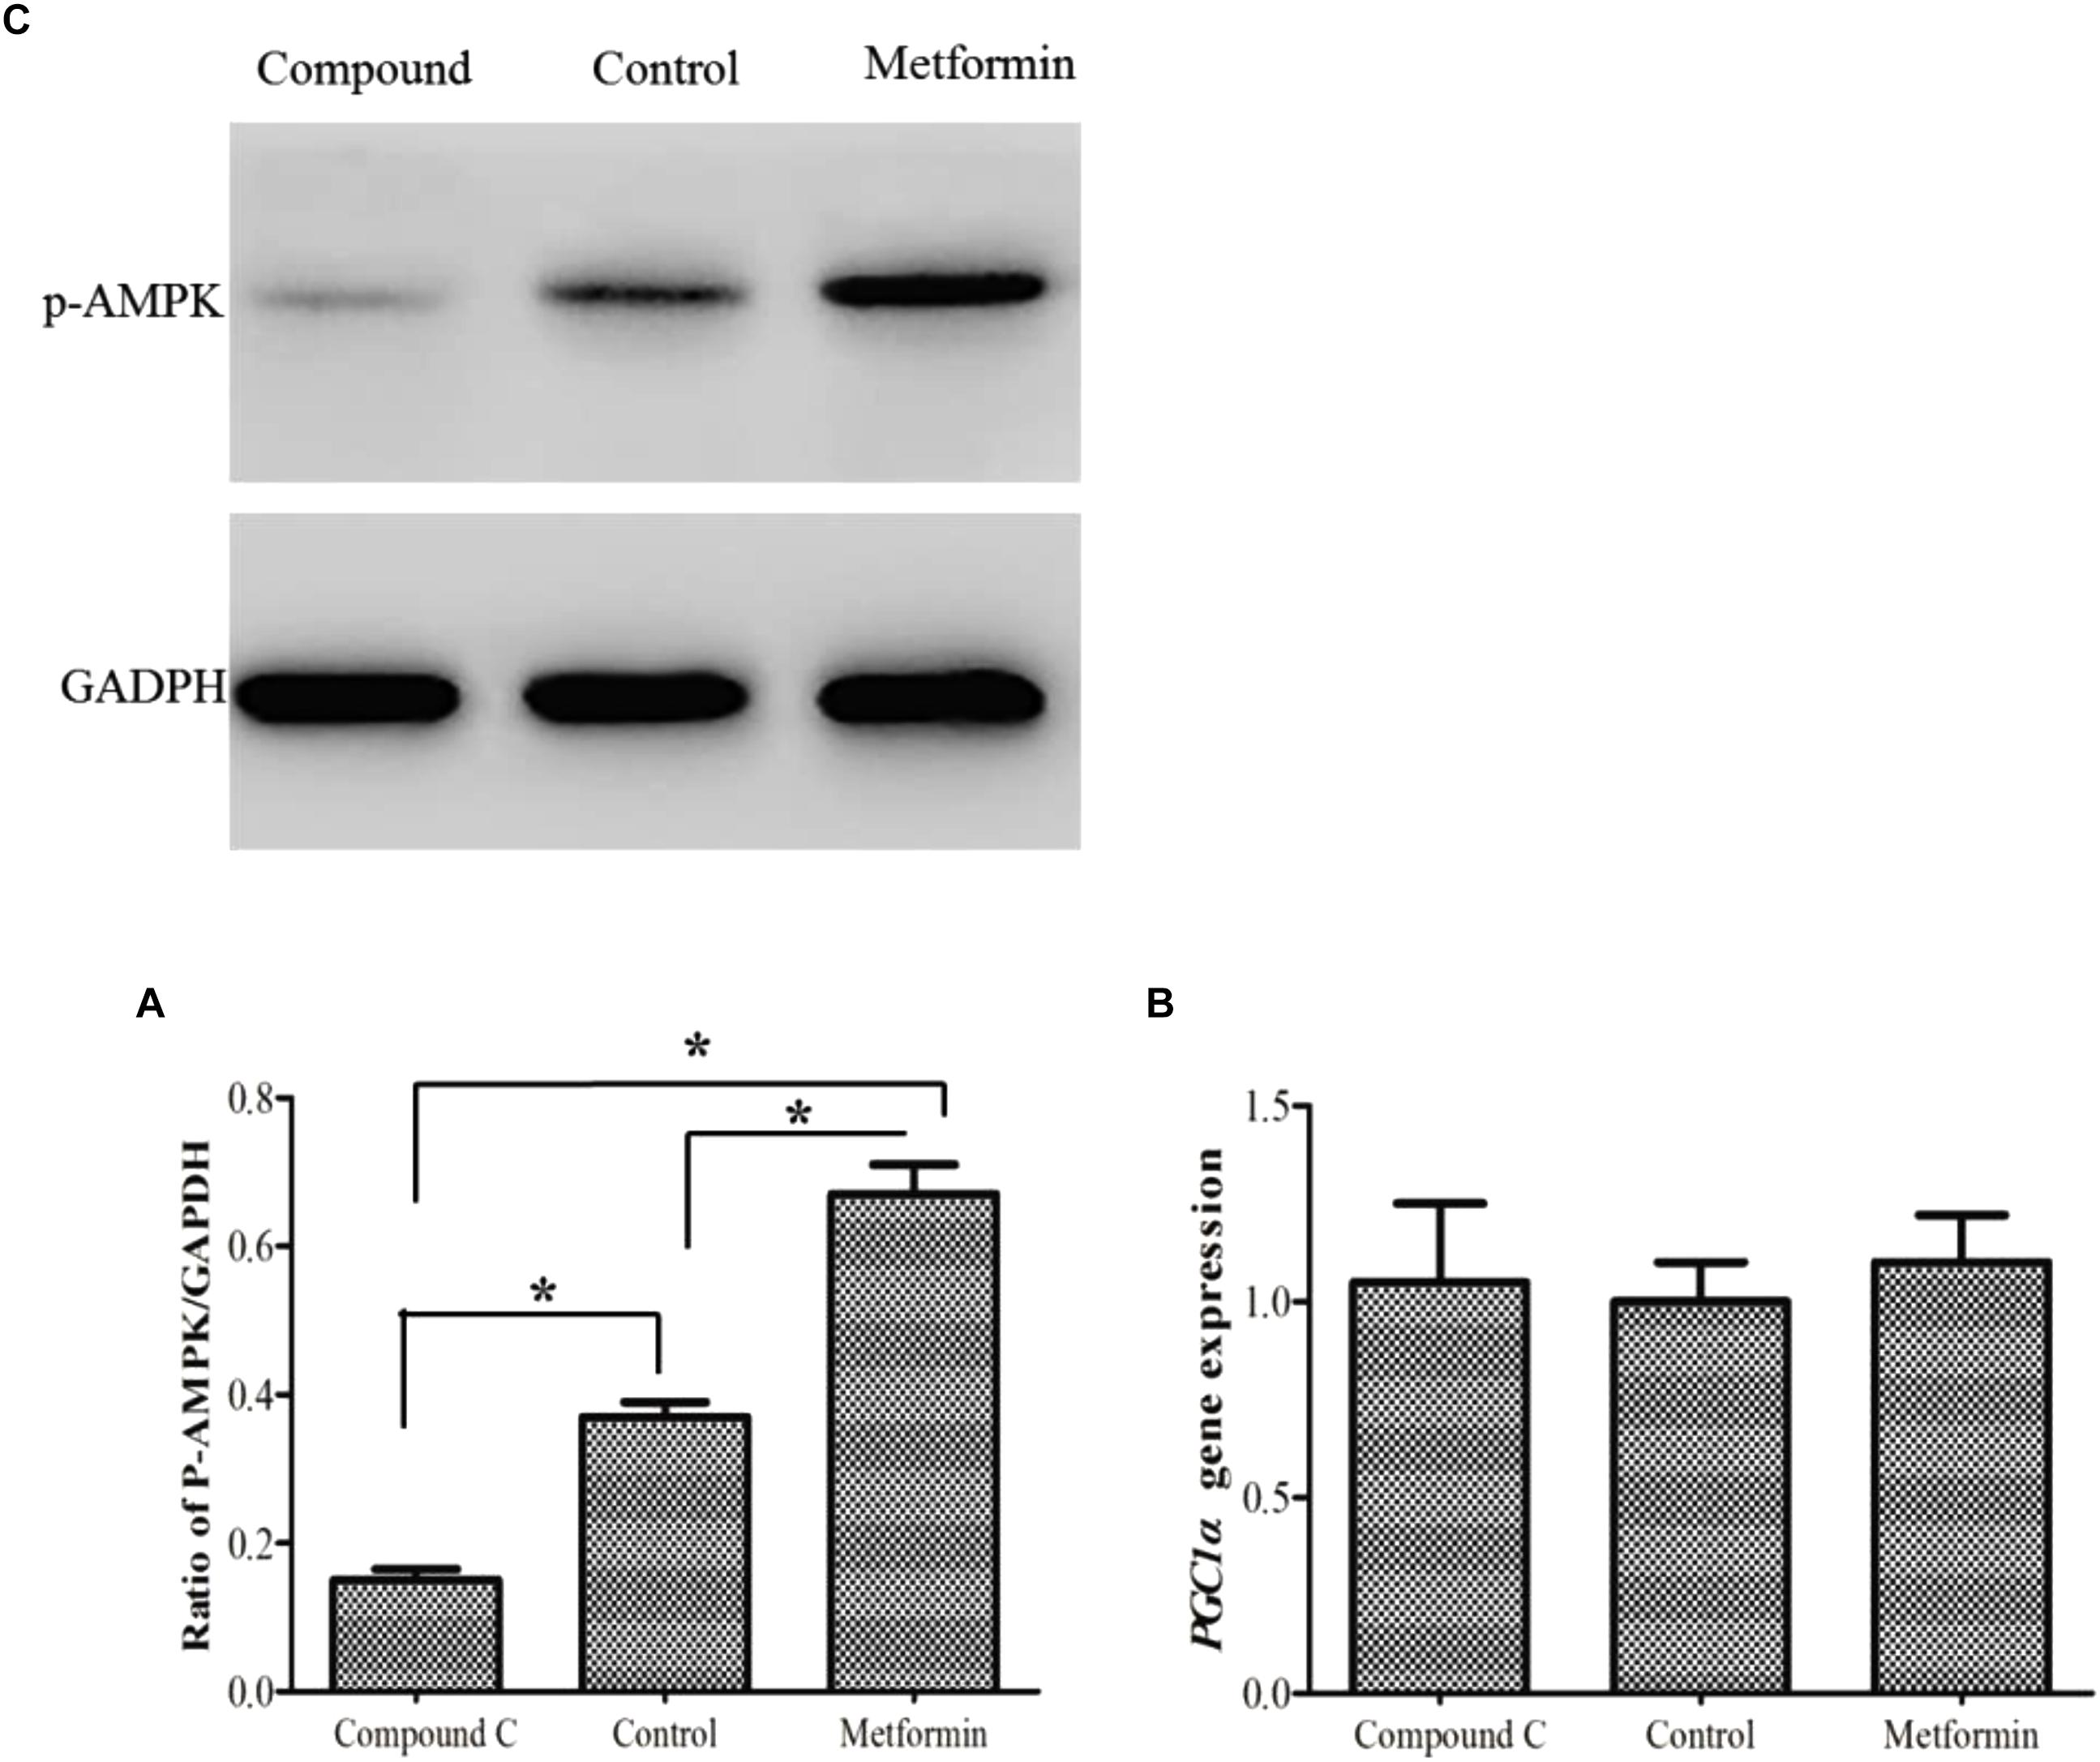
Figure 5. Phospho-AMPK level (A) as determined by Western blot in primary hepatocytes of M. amblycephala after activation/inhibition. PGC1α gene expression (B) after AMPK activation/inhibition. One-way analysis of variance (ANOVA) with post hoc multiple comparison by Student–Newman–Keuls test was used to analyze differences. The asterisk indicate significant difference (P < 0.05).
Expressions of NRF1 and TFAM After Knockdown of PGC1α
Knockdown of PGC1α did not alter NRF1 or TFAM expression (Figure 6), supporting the possibility that PGC1α does not regulate the expression of NRF1 and TFAM in hepatocytes of M. amblycephala (Figure 6).
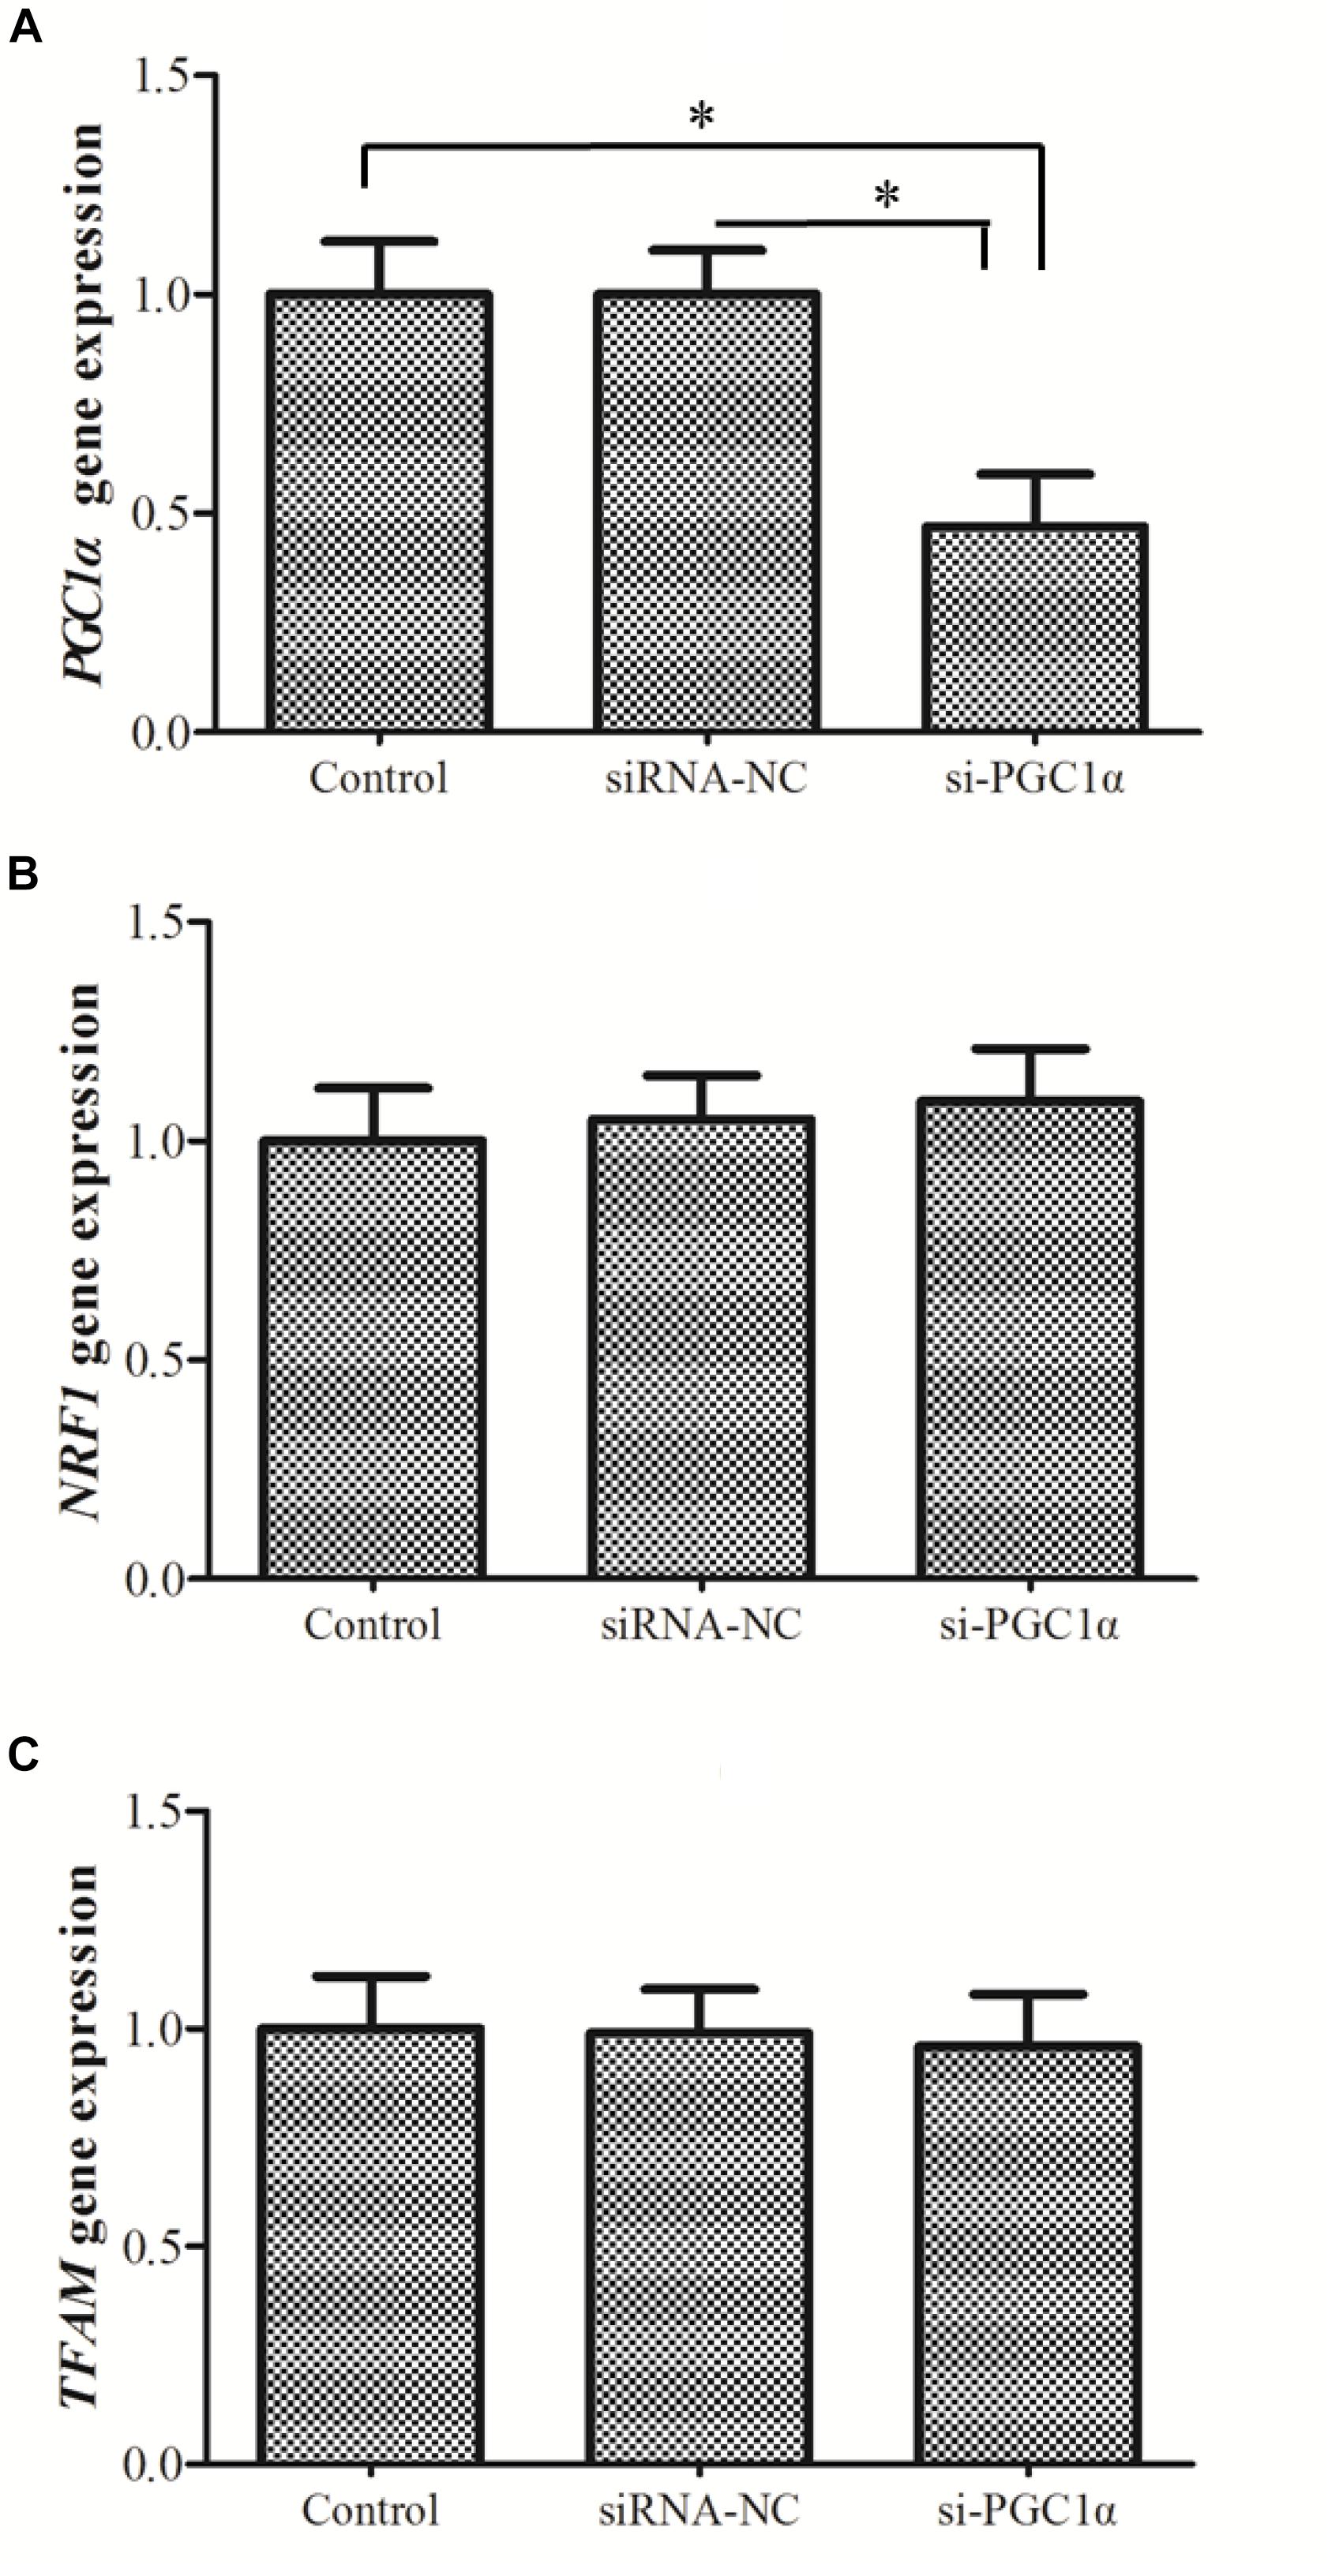
Figure 6. The expression of PGC1α (A), NRF1 (B), and TFAM (C) after the knockdown of PGC1α. siRNA-NC, negative control; si-PGC1α, siRNA-PGC1α group. One-way analysis of variance (ANOVA) with post hoc multiple comparison by Student–Newman–Keuls test was used to analyze differences. The asterisk indicate significant difference (P < 0.05).
Mitochondrial Biogenesis in Oleic Acid Treated Hepatocytes
Treatment of hepatocytes with oleic acid significantly down-regulated the expression of NRF1 (P = 0.002) and TFAM (P = 0.001) compared to the control group (Figure 7). Moreover, mtDNA copy number in the oleic acid treated group was significantly lower than (P = 0.01) that of the control group. But, PGC1α expression did not significantly differ between oleic acid and control groups.
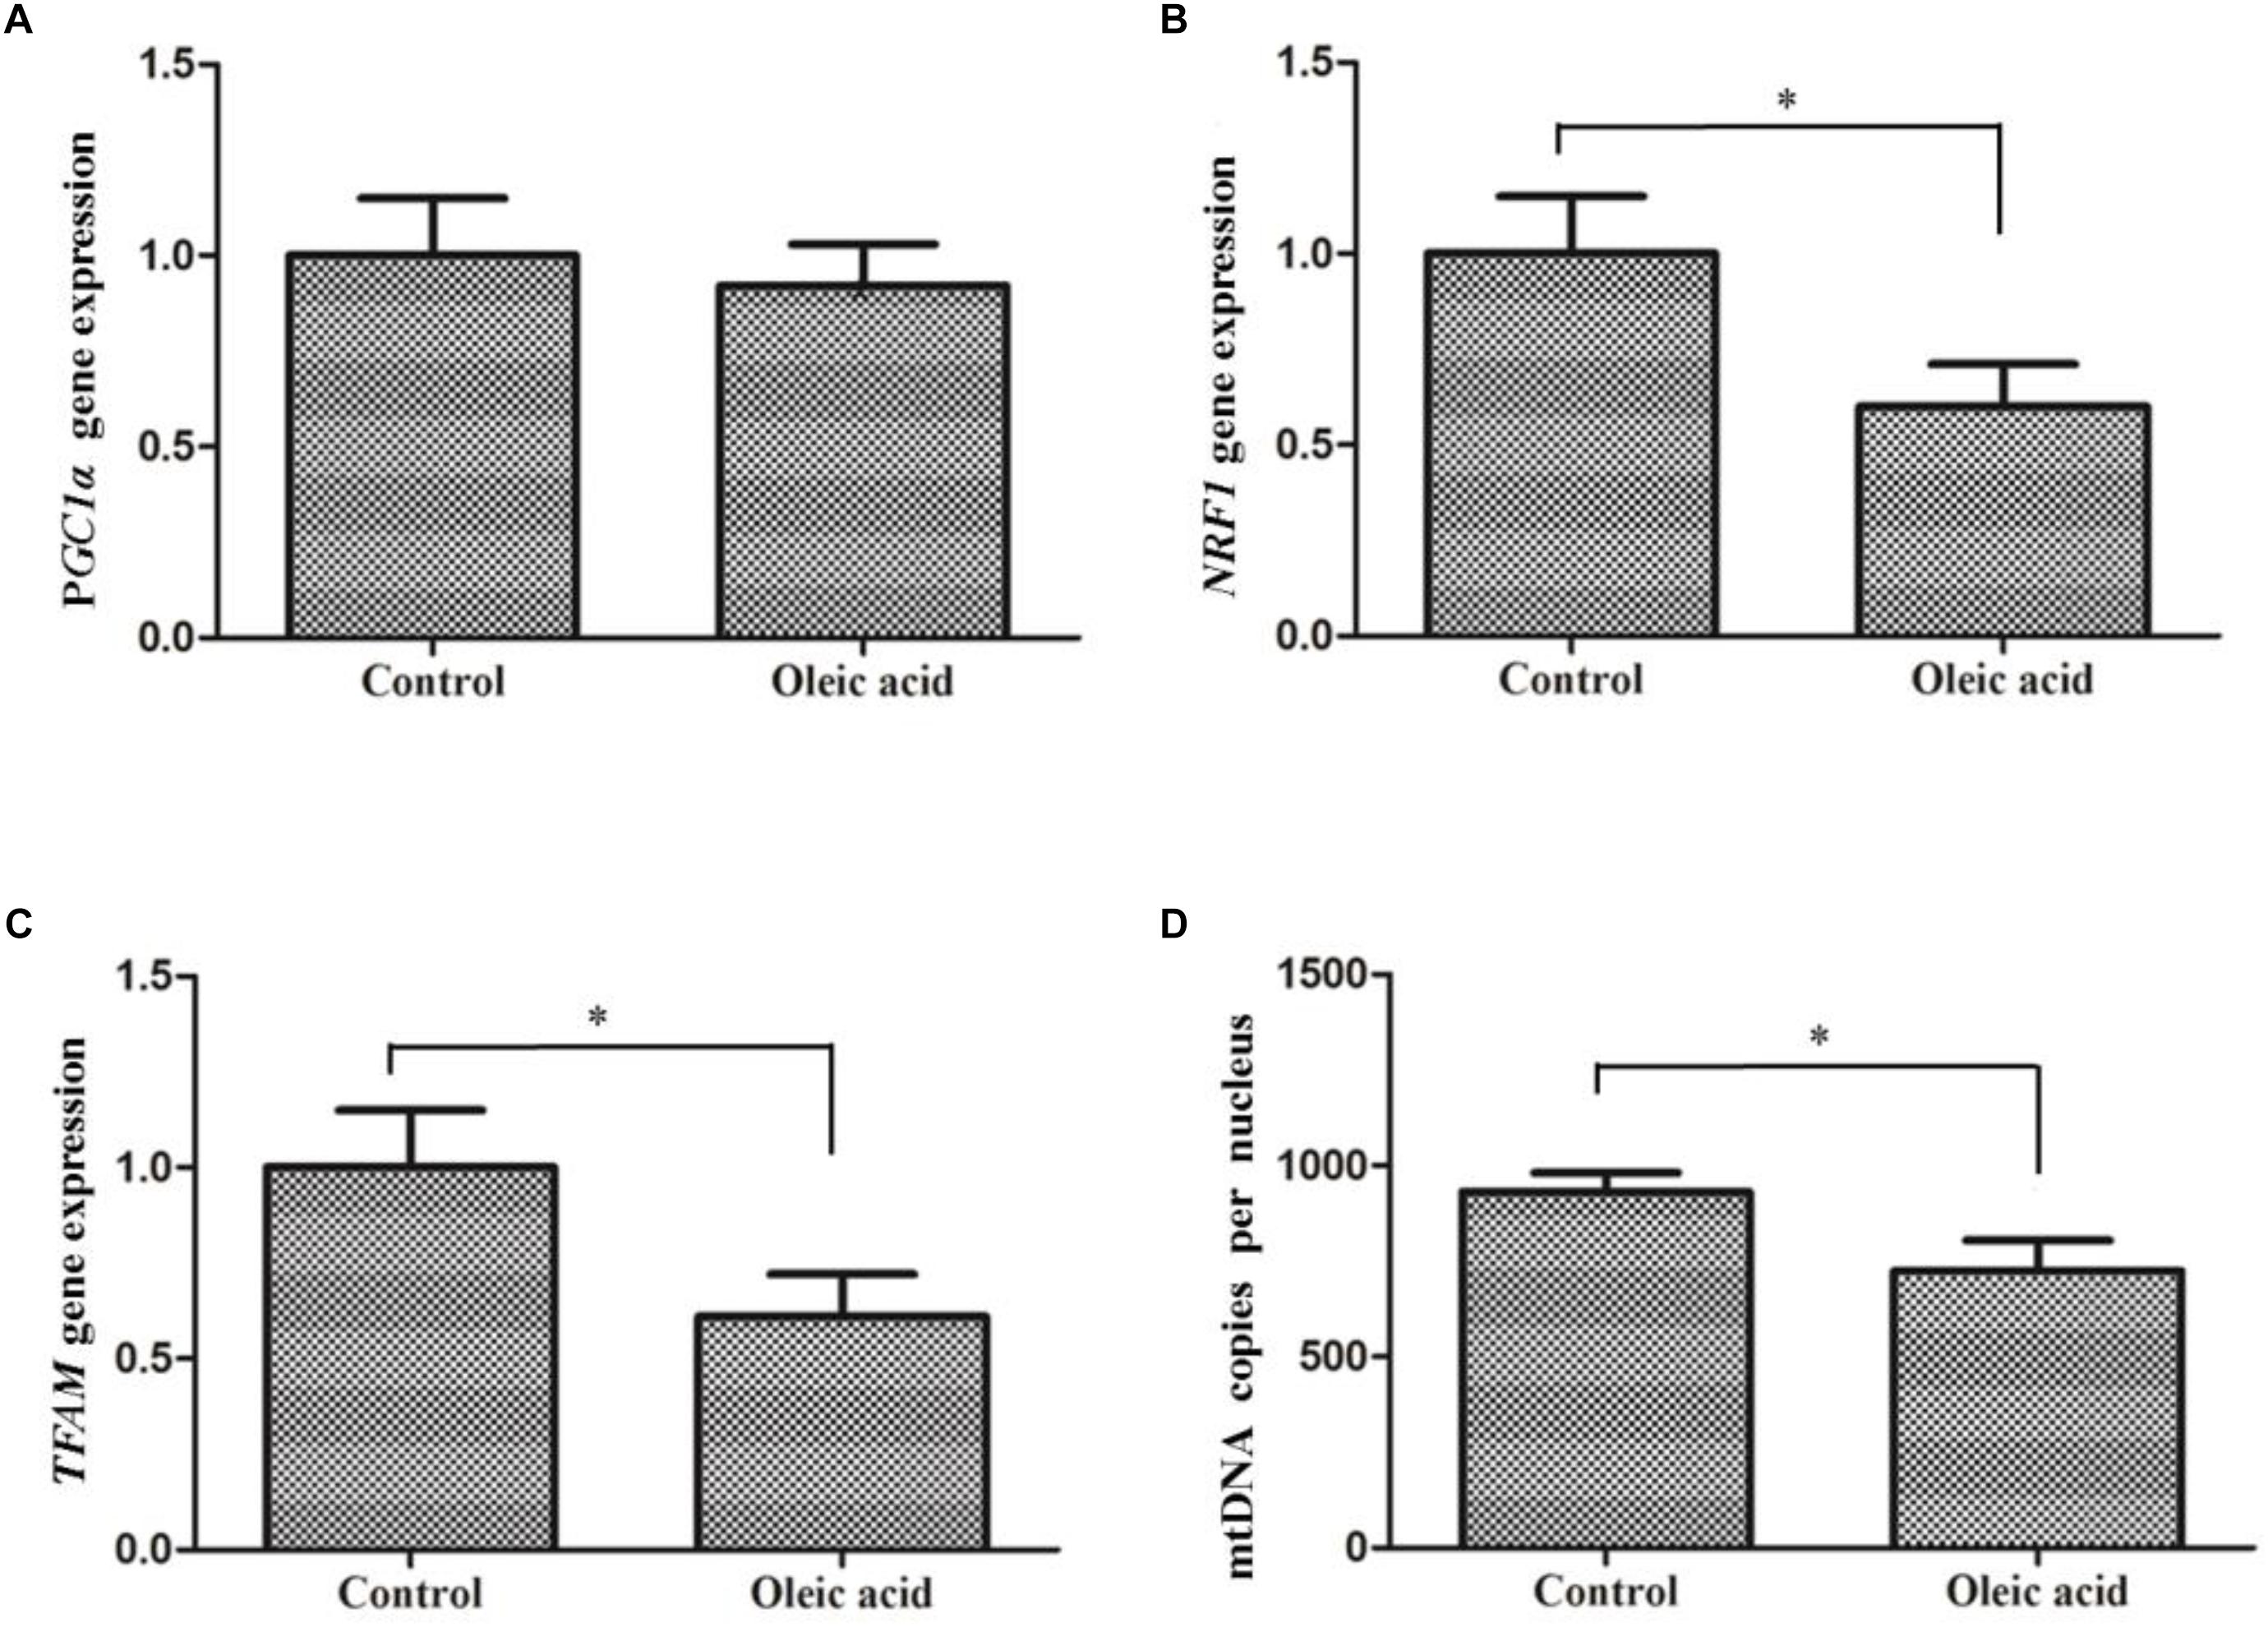
Figure 7. The expression of PGC1α (A), NRF1 (B), and TFAM (C) and mtDNA copy number (D) in primary hepatocytes of M. amblycephala treated with oleic acid. Student’s t-test was used to analyze differences and the asterisk indicate significant difference with Control group (P < 0.05).
Discussion
In mammals, PGC1α acts as a positive regulator of mitochondrial biogenesis and homeostasis, adaptive thermogenesis, gluconeogenesis, and some other metabolic processes (Handschin and Spiegelman, 2006). Although orthologs of PGC1 family members have been found in fish species, its molecular characterization and functional analysis have been less studied (Lin et al., 2005). The ratio of non-synonymous/synonymous substitution rates (ω = dn/ds) detected by Codeml software of PAML package can provide a measure for the change of selection pressures. Values of ω = 1, <1, and >1 indicate neutral evolution, purifying selection, and positive selection on the target gene, respectively. Positive selection plays an important role in gene duplication, functional diversification and genomic structural divergence (Misha and Dan, 2010; Song et al., 2012). Interestingly, we found a branch underwent positive selection when the fish evolved to amphibians, birds and mammals (ω = 1.27) suggesting that the function of PGC1α might differ between fish and other vertebrates. Moreover, the positive selection site also means mutation site which could affect the function of genes (Misha and Dan, 2010). The sequence in the human homologue containing an AMPK-phosphylated Thr (RIRTNP) differs from that of the PGC1α sequence identified from blunt snout bream (RIRPTP). Further, in some fish species, the Thr is not present in this sequence. Our results support the conjecture that the function divergence of PGC1α between fish and other vertebrates might be due to the positive selection in evolution of PGC1α.
Fish muscle contains great quantities of mitochondria, myoglobin and glycogen, and plays important roles in carbohydrate and lipid metabolism (Greek-Walker and Pull, 2010). Due to the crucial role of PGC1α in metabolism its expression level in muscle is often high. Meanwhile, expression of PGC1α in fat tissue was higher than liver (the main tissue for fatty acid oxidation in fish) which supports the role of PGC1α in differentiation and development of adipocytes (Waldman et al., 2016).
PGC1α is involved in regulating mitochondrial content in mammals and birds (Handschin and Spiegelman, 2006). In the current study, mtDNA copy number in different tissues revealed no correlation between PGC1α expression and mtDNA copy number. Furthermore, the results obtained by siRNA technology indicated that knockdown of PGC1α does not result in reduction of mtDNA copy number in primary hepatocytes of M. amblycephala. This is in contrast with the results of studies on mammalian cells where down-regulation of PGC1α often resulted in a robust decrease of mitochondrial number (Janice et al., 2002). These observations indicate that PGC1α does not appear to participate in the regulation of mitochondrial biogenesis in M. amblycephala, which is in agreement with previous findings (LeMoine et al., 2008; Bremer et al., 2012). This finding suggests a functional divergence between fish and mammals. In the context of metabolic remodeling in fish muscle in response to exercise and stressors, mitochondrial changes occurred in a PGC1α independent manner, possibly compensated through changes in PGC1β (McClelland et al., 2006; LeMoine et al., 2008). As the PGC1 family has three members (PGC1α, PGC1β, PRC), it is possible that another member may participate in the regulation of mitochondrial biogenesis in fish.
Mitochondrial metabolism provides the majority of the energy within eukaryotic cells, and AMPK-PGC1α-NRF1 pathway is thought to play a key role in this process (Scarpulla, 2011; Austin and St-Pierre, 2012; Picca and Lezza, 2015). In mammals, AMPK is an essential energy sensor and its activation is partially mediated by phosphorylating PGC1α (Narkar et al., 2008; Burkewitz et al., 2014). Also, fish AMPK is activated after diet intake and exercise (Fuentes et al., 2013; Magnoni et al., 2014). Mammalian AMPK phosphorylates PGC1α at Thr177 and Ser538 sites and activates PGC1α expression (Jäger et al., 2007). Phosphorylation of PGC1α by AMPK promotes mitochondrial biogenesis in murine muscle cells, and the mutation of both regulatory sites ablates PGC1α coactivating activity on its own promoter (Jäger et al., 2007). Moreover, it has been reported that there is an auto-regulatory loop whereby more active PGC1α induces its own transcription (Handschin et al., 2003). Thus, phosphorylation of PGC1α by AMPK often enhances PGC1α expression (Frier et al., 2012). In the present study, expression of PGC1α was assessed after AMPK activation/inhibition in hepatocytes and the result showed no significant alteration in PGC1α expression. This is consistent with previous reports indicating that there is no correlation between AMPK activity and PGC1α expression in fish (Bremer et al., 2016). PGC1α of M. amblycephala lacks the critical Thr177, which could be the reason for the absence of correlation between AMPK activation/inhibition and PGC1α expression.
PGC1α exerts its effects on the muscle phenotype via NRF1, NRF2 and myocyte enhancing factor 2c (MEF2c). It binds these transcription factors through independent motifs and mediates their respective roles in muscle metabolism (Wu et al., 1999; Michael et al., 2001; Lin et al., 2002; Vercauteren et al., 2008). Considered together, these features garnered PGC1α the label of a control gauge of oxidative metabolism in mammals (Puigserver and Spiegelman, 2003; Scarpulla, 2006). PGC1α activates the transcription of NRF1 which binds specifically to TFAM promoter (a direct regulator of mtDNA replication) (Austin and St-Pierre, 2012; Picca and Lezza, 2015). NRF1 can bind to numerous gene promoters to regulate mitochondrial functions such as mtDNA transcription and replication (Choi et al., 2002; Signorile et al., 2014). In general, NRF1 and PGC1α can bind together to form a heterodimer by an ill-defined region spanning amino acids 180–403 (Scarpulla, 2002). The binding of NRF1 and PGC1α can enhance the transcription of NRF1. Thus, in mammals, PGC1α can profoundly induce alterations in NRF1 and TFAM expression (Wu et al., 1999). However, our present results showed fish PGC1α did not affect NRF1 and TFAM expression. This can be explained by that fish PGC1α has a Ser- and Gln-rich insertions of 12–31 residues in the interaction domain and cannot bind with NRF1 (Bremer et al., 2016).
Mitochondrial biogenesis is a noticeable response of hepatocytes to a variety of physiological changes (Hood et al., 2000). Several dietary components such as resveratrol (Csiszar et al., 2009) and fatty acids (García-Ruiz et al., 2015; Lee et al., 2016) influence the mitochondrial biogenesis. It has been shown that EPA and DHA can modulate mitochondrial biogenesis which is linked to increased mtDNA replication and PGC1α expression (Lee et al., 2016). In this study, mtDNA copy number significantly decreased in oleic acid treated group. This was in agreement with the results of studies on mammals where saturated fatty acids reduced mitochondrial mass and caused mitochondrial dysfunction (García-Ruiz et al., 2015). Moreover, results of previous in vivo studies showed that administration of high-fat diets reduces mitochondrial mass and activity of the related enzymes in fish (Du et al., 2010; Lu et al., 2014). In order to clarify the underlying mechanism of mitochondrial biogenesis, expression of the genes involved in mitochondrial biogenesis in hepatocytes such as PGC1α, NRF1, and TFAM were examined in this study. Decreased expression of NRF1 and TFAM by oleic acid treatment indicated that oleic acid regulates mitochondrial mass potentially through mtDNA replication. However, PGC1α expression was not significantly influenced by oleic acid, and confirmed the notion that there is no correlation between PGC1α expression and mitochondrial content in hepatocytes of blunt snout bream.
Conclusion
The data generated in this study indicated that PGC1α does not take part in mitochondrial biogenesis in hepatocytes of blunt snout bream.
Author Contributions
KL and XS conceived and designed the experiments. KL, WZ, and LC performed the experiments. KL, SR, and XS analyzed the data and wrote the manuscript. KL, LC, and WZ contributed reagents, materials, and analysis tools.
Funding
This work was funded by National Natural Science Foundation of China (31602171), Natural Science Foundation of Fujian Province (2017J05056), Central Public-interest Scientific Institution Basal Research and Key Laboratory of Sustainable Development of Marine Fisheries, Ministry of Agriculture, China, CAFS (2018HY-XKQ01), and Natural Science Foundation of Shandong province (ZR2017LC025). Also, financial support of the Ministry of Education, Youth and Sports of the Czech Republic – projects “CENAKVA” (No. CZ.1.05/2.1.00/01.0024), “CENAKVA Center Development” (No. CZ.1.05/2.1.00/19.0380), and “CENAKVA II” (No. LO1205 under the NPU I program) and Biodiversity project (CZ.02.1.01/0.0/0.0/16_025/0007370) is highly acknowledged.
Conflict of Interest Statement
The authors declare that the research was conducted in the absence of any commercial or financial relationships that could be construed as a potential conflict of interest.
Supplementary Material
The Supplementary Material for this article can be found online at: https://www.frontiersin.org/articles/10.3389/fphys.2018.01957/full#supplementary-material
Footnotes
References
Austin, S., and St-Pierre, J. (2012). PGC1a and mitochondrial metabolism–emerging concepts and relevance in ageing and neurodegenerative disorders. J. Cell Sci. 125, 4963–4971. doi: 10.1242/jcs.113662
Bradford, M. M. (1976). A rapid and sensitive method for the quantitation of microgram quantities of protein utilizing the principle of protein-dye binding. Anal. Biochem. 72, 248–254. doi: 10.1016/0003-2697(76)90527-3
Bremer, K., Kocha, K. M., Snider, T., and Moyes, C. D. (2016). Sensing and responding to energetic stress: the role of the AMPK-PGC1α-NRF1 axis in control of mitochondrial biogenesis in fish. Comp. Biochem. Phys. B Biochem. Mol. Biol. 199, 4–12. doi: 10.1016/j.cbpb.2015.09.005
Bremer, K., Monk, C. T., Gurd, B. J., and Moyes, C. D. (2012). Transcriptional regulation of temperature-induced remodeling of muscle bioenergetics in goldfish. Am. J. Physiol. Regul. Integr. Comp. Physiol. 303, R150–R158. doi: 10.1152/ajpregu.00603.2011
Burkewitz, K., Zhang, Y., and Mair, W. B. (2014). AMPK at the nexus of energetics and aging. Cell Metab. 20, 10–25. doi: 10.1016/j.cmet.2014.03.002
Bustin, S. A., Benes, V., Garson, J. A., Hellemans, J., Huggett, J., Kubista, M., et al. (2011). Primer sequence disclosure: a clarification of the MIQE guidelines. Clin. Chem. 57, 919–921. doi: 10.1373/clinchem.2011.162958
Choi, Y. S., Lee, H. K., and Pak, Y. K. (2002). Characterization of the 5’-flanking region of the rat gene for mitochondrial transcription factor A (Tfam). Biochim. Biophys. Acta 1574, 200–204. doi: 10.1152/ajpregu.00603.2011
Csiszar, A., Labinskyy, N., and Pinto, J. T. (2009). Resveratrol induces mitochondrial biogenesis in endothelial cells. Am. J. Physiol. Heart Circ. Physiol. 297, H13–H20. doi: 10.1152/ajpheart.00368.2009
Du, Z. Y., Clouet, P., Huang, L. M., Degrace, P., Zheng, W. H., He, J. G., et al. (2010). Utilization of different dietary lipid sources at high level in herbivorous grass carp (Ctenopharyngodon idella): mechanism related to hepatic fatty acid oxidation. Aquacult. Nutr. 14, 77–92. doi: 10.1111/j.1365-2095.2007.00507.x
Frier, B. C., Wan, Z., Williams, D. B., Stefanson, A. L., and Wright, D. C. (2012). Epinephrine and AICAR-induced PGC-1α mRNA expression is intact in skeletal muscle from rats fed a high-fat diet. Am. J. Physiol. Cell Physiol. 302, C1772–C1779. doi: 10.1152/ajpcell.00410.2011
Fuentes, E. N., Safian, D., Einarsdottir, I. E., Valdés, J. A., Elorza, A. A., Molina, A., et al. (2013). Nutritional status modulates plasma leptin, AMPK and TOR activation, and mitochondrial biogenesis: implications for cell metabolism and growth in skeletal muscle of the fine flounder. Gen. Comp. Endocrinol. 186, 172–180. doi: 10.1016/j.ygcen.2013.02.009
García-Ruiz, I., Solís-Muñoz, P., Fernández-Moreira, D., Muñoz-Yagüe, T., and Solís-Herruzo, J. A. (2015). In vitro treatment of HepG2 cells with saturated fatty acids reproduces mitochondrial dysfunction found in nonalcoholic steatohepatitis. Dis. Model. Mech. 8, 183–191. doi: 10.1242/dmm.018234
Goto, M., Terada, S., Kato, M., Katoh, M., Yokozeki, T., and Tabata, I. (2000). cDNA Cloning and mRNA analysis of PGC-1 in epitrochlearis muscle in swimming-exercised rats. Biochem. Biophys. Res. Commun. 274, 350–354. doi: 10.1006/bbrc.2000.3134
Greek-Walker, M., and Pull, G. A. (2010). A survey of red and white muscle in marine fish. J. Fish Biol. 7, 295–300. doi: 10.1111/j.1095-8649.1975.tb04602.x
Handschin, C., Rhee, J., Lin, J., Tarr, P. T., and Spiegelman, B. M. (2003). An autoregulatory loop controls peroxisome proliferator-activated receptor gamma coactivator 1alpha expression in muscle. Proc. Natl. Acad. Sci. U.S.A. 100, 7111–7116. doi: 10.1073/pnas.1232352100
Handschin, C., and Spiegelman, B. M. (2006). Peroxisome proliferator-activated receptor gamma coactivator 1 coactivators, energy homeostasis, and metabolism. Endocr. Rev. 27, 728–735. doi: 10.1210/er.2006-0037
Hood, D. A., Takahashi, M., Connor, M. K., and Freyssenet, D. (2000). Assembly of the cellular powerhouse: current issues in muscle mitochondrial biogenesis. Exerc. Sport Sci. Rev. 28, 68–73.
Jäger, S., Handschin, C., Pierre, J. S., and Spiegelman, B. M. (2007). AMP-activated protein kinase (AMPK) action in skeletal muscle via direct phosphorylation of PGC-1α. Proc. Natl. Acad. Sci. U.S.A. 104, 12017–12022. doi: 10.1073/pnas.0705070104
Janice, M. H., Ryan, P. K., and Daniel, P. K. (2002). Peroxisome proliferator-activated receptor coactivator-1α (PGC-1α) coactivates the cardiac-enriched nuclear receptors estrogen-related receptor-α and -γ. J. Biol. Chem. 277, 40265–40274. doi: 10.1074/jbc.M206324200
Laemmli, U. K. (1970). Cleavage of structural proteins during the assembly of the head of bacteriophage T4. Nature 227, 680–685. doi: 10.1038/227680a0
Lee, M. S., Shin, Y., Moon, S., Kim, S., and Kim, Y. (2016). Effects of eicosapentaenoic acid and docosahexaenoic acid on mitochondrial DNA replication and PGC-1α gene expression in C2C12 muscle cells. Prev. Nutr. Food Sci. 21, 317–322. doi: 10.3746/pnf.2016.21.4.317
LeMoine, C. M., Genge, C. E., and Moyes, C. D. (2008). Role of the PGC-1 family in the metabolic adaptation of goldfish to diet and temperature. J. Exp. Biol. 211, 1448–1455. doi: 10.1242/jeb.014951
Lin, J., Handschin, C., and Spiegelman, B. M. (2005). Metabolic control through the PGC-1 family of transcription coactivators. Cell Metab. 1, 361–370. doi: 10.1016/j.cmet.2005.05.004
Lin, J., Wu, H., Tarr, P. T., Zhang, C. Y., Wu, Z., Boss, O., et al. (2002). Transcriptional co-activator PGC-1 alpha drives the formation of slow-twitch muscle fibres. Nature 418, 797–801.
Lu, K. L., Xu, W. N., Li, J. Y., Li, X. F., Huang, G. Q., and Liu, W. B. (2013a). Alterations of liver histology and blood biochemistry in blunt snout bream Megalobrama amblycephala fed high-fat diets. Fish. Sci. 79, 661–671. doi: 10.1007/s12562-013-0635-4
Lu, K. L., Xu, W. N., Li, X. F., Liu, W. B., Wang, L. N., and Zhang, C. N. (2013b). Hepatic triacylglycerol secretion, lipid transport and tissue lipid uptake in blunt snout bream (Megalobrama amblycephala) fed high-fat diet. Aquaculture 40, 160–168. doi: 10.1016/j.aquaculture.2013.06.003
Lu, K. L., Xu, W. N., Liu, W. B., Wang, L. N., Zhang, C. N., and Li, X. F. (2014). Association of mitochondrial dysfunction with oxidative stress and immune suppression in blunt snout bream Megalobrama amblycephala fed a high-fat diet. J. Aquat. Anim. Health 26, 100–112. doi: 10.1080/08997659.2014.893460
Magnoni, L. J., Palstra, A. P., and Planas, J. V. (2014). Fueling the engine: induction of AMP-activated protein kinase in trout skeletal muscle by swimming. J. Exp. Biol. 217, 1649–1652. doi: 10.1242/jeb.099192
McClelland, G. B., Craig, P. M., Dhekney, K., and Dipardo, S. (2006). Temperature- and exercise-induced gene expression and metabolic enzyme changes in skeletal muscle of adult zebrafish (Danio rerio). J. Physiol. 577, 739–751. doi: 10.1113/jphysiol.2006.119032
Michael, L. F., Wu, Z., Cheatham, R. B., Puigserver, P., Adelmant, G., Lehman, J. J., et al. (2001). Restoration of insulin-sensitive glucose transporter (GLUT4) gene expression in muscle cells by the transcriptional coactivator PGC-1. Proc. Natl. Acad. Sci. U.S.A. 98, 3820–3825. doi: 10.1073/pnas.061035098
Misha, S., and Dan, S. T. (2010). Mutational effects and the evolution of new protein functions. Nat. Rev. Genet. 11, 572–582. doi: 10.1038/nrg2808
Mortensen, O. H., Frandsen, L., Schjerling, P., Nishimura, E., and Grunnet, N. (2006). PGC-1alpha and PGC-1beta have both similar and distinct effects on myofiber switching toward an oxidative phenotype. Am. J. Physiol. Endocrinol. Metab. 291, E807–E816. doi: 10.1152/ajpendo.00591.2005
Narkar, V. A., Downes, M., Yu, R. T., Embler, E., Wang, Y. X., Banayo, E., et al. (2008). AMPK and PPARdelta agonists are exercise mimetics. Cell 134, 405–415. doi: 10.1016/j.cell.2008.06.051
Picca, A., and Lezza, A. M. (2015). Regulation of mitochondrial biogenesis through TFAM-mitochondrial DNA interactions: useful insights from aging and calorie restriction studies. Mitochondrion 25, 67–75. doi: 10.1016/j.mito.2015.10.001
Puigserver, P., and Spiegelman, B. M. (2003). Peroxisome proliferator-activated receptor-gamma coactivator 1 alpha (PGC-1 alpha): transcriptional coactivator and metabolic regulator. Endocr. Rev. 24, 78–90. doi: 10.1210/er.2002-0012
Puigserver, P., Wu, Z., Park, C. W., Graves, R., Wright, M., and Spiegelman, B. M. (1998). A cold-inducible coactivator of nuclear receptors linked to adaptive thermogenesis. Cell 92, 829–839. doi: 10.1016/S0092-8674(00)81410-5
Reverter, A., Okimoto, R., Sapp, R., Bottje, W. G., Hawken, R., and Hudson, N. J. (2017). Chicken muscle mitochondrial content appears co-ordinately regulated and is associated with performance phenotypes. Biol. Open 6, 50–58. doi: 10.1242/bio.022772
Scarpulla, R. C. (2002). Nuclear activators and coactivators in mammalian mitochondrial biogenesis. Biochim. Biophys. Acta 1576, 1–14. doi: 10.1016/S0167-4781(02)00343-3
Scarpulla, R. C. (2006). Nuclear control of respiratory gene expression in mammalian cells. J. Cell. Biochem. 97, 673–683. doi: 10.1002/jcb.20743
Scarpulla, R. C. (2011). Metabolic control of mitochondrial biogenesis through the PGC-1 family regulatory network. Biochim. Biophys. Acta 1813, 1269–1278. doi: 10.1016/j.bbamcr.2010.09.019
Sémon, M., and Wolfe, K. H. (2007). Rearrangement rate following the whole-genome duplication in teleosts. Mol. Biol. Evol. 24, 860–867. doi: 10.1093/molbev/msm003
Signorile, A., Micelli, L., De, R. D., Santeramo, A., Papa, F., Ficarella, R., et al. (2014). Regulation of the biogenesis of OXPHOS complexes in cell transition from replicating to quiescent state: involvement of PKA and effect of hydroxytyrosol. Biochim. Biophys. Acta 1843, 675–684. doi: 10.1016/j.bbamcr.2013.12.017
Song, X., Jin, P., Qin, S., Chen, L., and Ma, F. (2012). The evolution and origin of animal Toll-like receptor signaling pathway revealed by network-level molecular evolutionary analyses. PLoS One 7:e51657. doi: 10.1371/journal.pone.0051657
Sun, Y., Zeng, S., Hu, L., Lu, G., and Lin, G. (2012). A new method for precise determination of mitochondrial DNA copies in human embryonic stem cells with real-time PCR. Chin. J. Cell Biol. 34, 685–689.
Uldry, M., Yang, W., St-Pierre, J., Lin, J., Seale, P., and Spiegelman, B. M. (2006). Complementary action of the PGC-1 coactivators in mitochondrial biogenesis and brown fat differentiation. Cell Metab. 3, 333–341. doi: 10.1016/j.cmet.2006.04.002
Vercauteren, K., Gleyzer, N., and Scarpulla, R. C. (2008). PGC-1-related coactivator complexes with HCF-1 and NRF-2beta in mediating NRF-2(GABP)-dependent respiratory gene expression. J. Biol. Chem. 283, 12102–12111. doi: 10.1074/jbc.M710150200
Waldman, M., Bellner, L., Vanella, L., Schragenheim, J., Sodhi, K., Singh, S. P., et al. (2016). Epoxyeicosatrienoic acids regulate adipocyte differentiation of mouse 3T3 cells, via PGC-1α activation, which is required for HO-1 expression and increased mitochondrial function. Stem Cells Dev. 25, 1084–1094. doi: 10.1089/scd.2016.0072
Wu, Z., Puigserver, P., Andersson, U., Zhang, C., Adelmant, G., Mootha, V., et al. (1999). Mechanisms controlling mitochondrial biogenesis and respiration through the thermogenic coactivator PGC-1. Cell 98, 115–124. doi: 10.1016/S0092-8674(00)80611-X
Keywords: blunt snout bream, PGC1α, molecular characterization, mitochondrial biogenesis, gene cloning
Citation: Song X, Rahimnejad S, Zhou W, Cai L and Lu K (2019) Molecular Characterization of Peroxisome Proliferator-Activated Receptor-Gamma Coactivator-1α (PGC1α) and Its Role in Mitochondrial Biogenesis in Blunt Snout Bream (Megalobrama amblycephala). Front. Physiol. 9:1957. doi: 10.3389/fphys.2018.01957
Received: 25 August 2018; Accepted: 23 December 2018;
Published: 24 January 2019.
Edited by:
Rubina Sirri, University of Bologna, ItalyReviewed by:
Wayne R. Fitzgibbon, Medical University of South Carolina, United StatesIvan Viegas, University of Coimbra, Portugal
Copyright © 2019 Song, Rahimnejad, Zhou, Cai and Lu. This is an open-access article distributed under the terms of the Creative Commons Attribution License (CC BY). The use, distribution or reproduction in other forums is permitted, provided the original author(s) and the copyright owner(s) are credited and that the original publication in this journal is cited, in accordance with accepted academic practice. No use, distribution or reproduction is permitted which does not comply with these terms.
*Correspondence: Kangle Lu, lukangle@jmu.edu.cn
†These authors have contributed equally to this work